Number of Schools
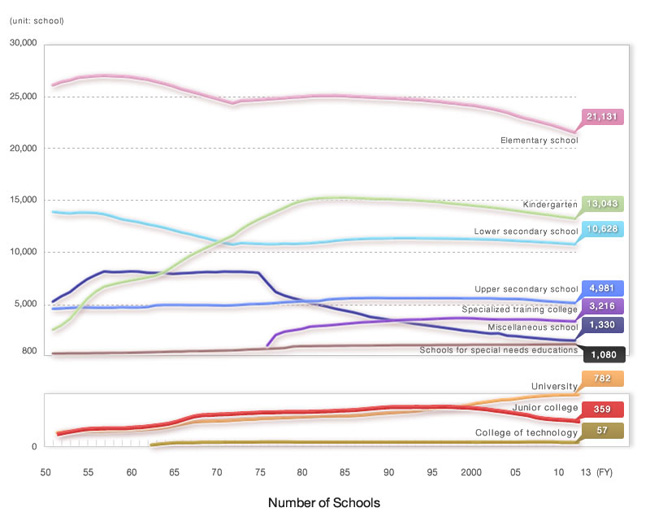
Number of Schools (1/2)
| (unit : school) |
| FY |
Total |
Kindergarten |
Elementary School |
Lower secondary school |
Upper secondary school |
Secondary school |
School for the blind |
School for the deaf |
| 1950 |
51,136 |
2,100 |
25,878 |
14,165 |
4,292 |
・・・ |
76 |
82 |
| 1960 |
60,488 |
7,207 |
26,858 |
12,986 |
4,598 |
・・・ |
76 |
103 |
| 1970 |
60,782 |
10,796 |
24,790 |
11,040 |
4,798 |
・・・ |
75 |
108 |
| 1980 |
65,533 |
14,893 |
24,945 |
10,780 |
5,208 |
・・・ |
73 |
110 |
| 1990 |
65,529 |
15,076 |
24,827 |
11,275 |
5,506 |
・・・ |
70 |
108 |
| 1995 |
64,869 |
14,856 |
24,548 |
11,274 |
5,501 |
・・・ |
70 |
107 |
| 2000 |
63,352 |
14,451 |
24,106 |
11,209 |
5,478 |
4 |
71 |
107 |
| 2005 |
61,092 |
13,949 |
23,123 |
11,035 |
5,418 |
19 |
71 |
106 |
| 2006 |
60,569 |
13,835 |
22,878 |
10,992 |
5,385 |
27 |
71 |
104 |
| 2007 |
60,072 |
13,723 |
22,693 |
10,955 |
5,313 |
32 |
・・・ |
・・・ |
| 2008 |
59,555 |
13,626 |
22,476 |
10,915 |
5,243 |
37 |
・・・ |
・・・ |
| 2009 |
59,017 |
13,516 |
22,258 |
10,864 |
5,183 |
42 |
・・・ |
・・・ |
| 2010 |
58,418 |
13,392 |
22,000 |
10,815 |
5,116 |
48 |
・・・ |
・・・ |
| 2011 |
57,845 |
13,299 |
21,721 |
10,751 |
5,060 |
49 |
・・・ |
・・・ |
| 2012 |
57,312 |
13,170 |
21,460 |
10,699 |
5,022 |
49 |
・・・ |
・・・ |
| 2013 |
56,657 |
13,043 |
21,131 |
10,628 |
4,981 |
50 |
・・・ |
・・・ |
| |
(National) |
407 |
49 |
74 |
73 |
15 |
4 |
・・・ |
・・・ |
| |
(Local) |
40,450
|
4,817 |
20,836 |
9,784 |
3,646 |
29 |
・・・ |
・・・ |
| |
(Private) |
15,800 |
8,177 |
221 |
771 |
1,320 |
17 |
・・・ |
・・・ |
Number of Schools (2/2)
| (unit : school) |
| FY |
School for the other disabled |
Schools for special needs education |
College of technology |
Junior college(2) |
University(1) |
Specialized training college |
Miscellaneous school |
| 1950 |
3 |
・・・ |
・・・ |
149 |
201 |
・・・ |
4,190 |
| 1960 |
46 |
・・・ |
・・・ |
280 |
245 |
・・・ |
8,089 |
| 1970 |
234 |
・・・ |
60 |
479 |
382 |
・・・ |
8,011 |
| 1980 |
677 |
・・・ |
62 |
517 |
446 |
2,520 |
5,302 |
| 1990 |
769 |
・・・ |
62 |
593 |
507 |
3,300 |
3,436 |
| 1995 |
790 |
・・・ |
62 |
596 |
565 |
3,476 |
2,821 |
| 2000 |
814 |
・・・ |
62 |
572 |
649 |
3,551 |
2,278 |
| 2005 |
825 |
・・・ |
63 |
488 |
726 |
3,439 |
1,830 |
| 2006 |
831 |
・・・ |
64 |
468 |
744 |
3,441 |
1,729 |
| 2007 |
・・・ |
1,013 |
64 |
434 |
756 |
3,435 |
1,654 |
| 2008 |
・・・ |
1,026 |
64 |
417 |
765 |
3,401 |
1,585 |
| 2009 |
・・・ |
1,030 |
64 |
406 |
773 |
3,348 |
1,533 |
| 2010 |
・・・ |
1,039 |
58 |
395 |
778 |
3,311 |
1,466 |
| 2011 |
・・・ |
1,049 |
57 |
387 |
780 |
3,266 |
1,426 |
| 2012 |
・・・ |
1,059 |
57 |
372 |
783 |
3,249 |
1,392 |
| 2013 |
・・・ |
1,080 |
57 |
359 |
782 |
3,216 |
1,330 |
| |
(National) |
・・・ |
45 |
51 |
- |
86 |
10 |
- |
| |
(Local) |
・・・ |
1,021 |
3 |
19
|
90 |
196 |
9 |
| |
(Private) |
・・・ |
14 |
3 |
340 |
606 |
3,010 |
1,321 |
- (1)
- Not including 6 universities providing correspondence courses only (Universitiy of the Air and 5 private university).
- (2)
- Not including 1 junior college providing correspondence course only (1 private junior college).
Source:MEXT,School Basic Survey
Students
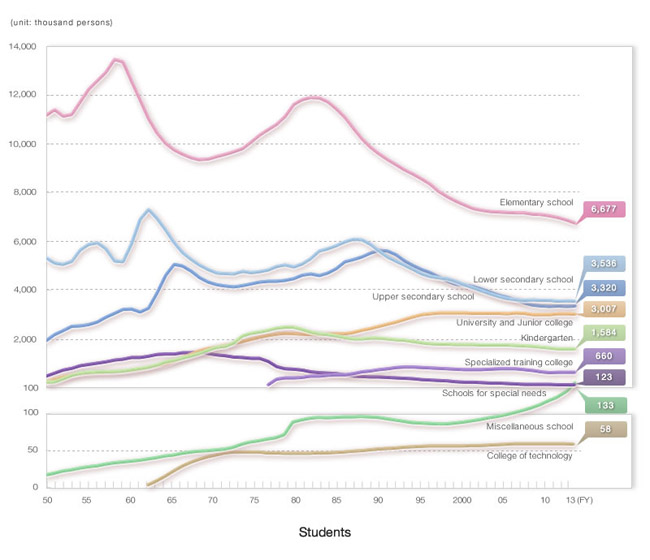
Students (1/2)
| (unit : person) |
| FY |
Total |
Kindergarten |
Elementary School |
Lower secondary school |
Upper secondary school |
Secondary school |
School for the blind |
School for the deaf |
| 1950 |
19,427,182 |
224,653 |
11,191,401 |
5,332,515 |
1,935,118 |
・・・ |
5,155 |
11,600 |
| 1960 |
24,457,713 |
742,367 |
12,590,680 |
5,899,973 |
3,239,416 |
・・・ |
10,261 |
20,723 |
| 1970 |
23,235,009 |
1,674,625 |
9,493,485 |
4,716,833 |
4,231,542 |
・・・ |
9,510 |
16,586 |
| 1980 |
27,451,909 |
2,407,093 |
11,826,573 |
5,094,402 |
4,621,930 |
・・・ |
8,113 |
11,577 |
| 1990 |
26,349,707 |
2,007,964 |
9,373,295 |
5,369,162 |
5,623,336 |
・・・ |
5,599 |
8,169 |
| 1995 |
23,796,698 |
1,808,432 |
8,307,246 |
4,570,390 |
4,724,945 |
・・・ |
4,611 |
7,257 |
| 2000 |
21,598,920 |
1,773,682 |
7,366,079 |
4,103,717 |
4,165,434 |
1,702 |
4,089 |
6,818 |
| 2005 |
20,367,965 |
1,738,766 |
7,197,458 |
3,626,415 |
3,605,242 |
7,456 |
3,809 |
6,639 |
| 2006 |
20,147,205 |
1,726,520 |
7,187,417 |
3,601,527 |
3,494,513 |
11,648 |
3,688 |
6,544 |
| 2007 |
19,907,976 |
1,705,402 |
7,132,874 |
3,614,552 |
3,406,561 |
14,902 |
・・・ |
・・・ |
| 2008 |
19,748,904 |
1,674,163 |
7,121,781 |
3,592,378 |
3,367,489 |
17,689 |
・・・ |
・・・ |
| 2009 |
19,605,281 |
1,630,336 |
7,063,606 |
3,600,323 |
3,347,311 |
20,544 |
・・・ |
・・・ |
| 2010 |
19,541,832 |
1,605,912 |
6,993,376 |
3,558,166 |
3,368,693 |
23,759 |
・・・ |
・・・ |
| 2011 |
19,430,606 |
1,596,170 |
6,887,292 |
3,573,821 |
3,349,255 |
26,759 |
・・・ |
・・・ |
| 2012 |
19,283,319 |
1,604,225 |
6,764,619 |
3,552,663 |
3,355,609 |
28,644 |
・・・ |
・・・ |
| 2013 |
19,127,474 |
1,583,610 |
6,676,920 |
3,536,182 |
3,319,640 |
30,226 |
・・・ |
・・・ |
| |
(male) |
9,878,168
|
803,539 |
3,416,071 |
1,808,914 |
1,672,326 |
14,714 |
・・・ |
・・・ |
| |
(female) |
9,249,306 |
780,071 |
3,260,849 |
1,727,268 |
1,647,314 |
15,512 |
・・・ |
・・・ |
| |
(National) |
761,500 |
5,785 |
42,093 |
31,437 |
8,585 |
3,014 |
・・・ |
・・・ |
| |
(Local) |
12,706,531 |
274,164 |
6,556,527 |
3,255,326 |
2,287,673 |
19,134 |
・・・ |
・・・ |
| |
(Private) |
5,659,443 |
1,303,661 |
78,300 |
249,419 |
1,023,382 |
8,078 |
・・・ |
・・・ |
Students (2/2)
| (unit : person) |
| FY |
School for the other disabled |
Schools for special needs education |
College of technology |
Junior college |
University |
Specialized training college |
Miscellaneous school |
| 1950 |
110 |
・・・ |
・・・ |
15,098 |
224,923 |
・・・ |
486,609 |
| 1960 |
4,794 |
・・・ |
・・・ |
83,457 |
626,421 |
・・・ |
1,239,621 |
| 1970 |
24,700 |
・・・ |
44,314 |
263,219 |
1,406,521 |
・・・ |
1,352,686 |
| 1980 |
72,122 |
・・・ |
46,348 |
371,124 |
1,835,312 |
432,914 |
724,401 |
| 1990 |
79,729 |
・・・ |
52,930 |
479,389 |
2,133,362 |
791,431 |
425,341 |
| 1995 |
74,966 |
・・・ |
56,234 |
498,516 |
2,546,649 |
813,347 |
321,105 |
| 2000 |
79,197 |
・・・ |
56,714 |
327,680 |
2,740,023 |
750,824 |
222,961 |
| 2005 |
91,164 |
・・・ |
59,160 |
219,355 |
2,865,051 |
783,783 |
163,667 |
| 2006 |
94,360 |
・・・ |
59,380 |
202,254 |
2,859,212 |
750,208 |
149,934 |
| 2007 |
・・・ |
108,173 |
59,386 |
186,667 |
2,828,708 |
703,490 |
147,261 |
| 2008 |
・・・ |
112,334 |
59,446 |
172,726 |
2,836,127 |
657,502 |
137,269 |
| 2009 |
・・・ |
117,035 |
59,386 |
160,976 |
2,845,908 |
624,875 |
134,981 |
| 2010 |
・・・ |
121,815 |
59,542 |
155,273 |
2,887,414 |
637,897 |
129,985 |
| 2011 |
・・・ |
126,123 |
59,220 |
150,007 |
2,893,489 |
645,834 |
122,636 |
| 2012 |
・・・ |
129,994 |
58,765 |
141,970 |
2,876,134 |
650,501 |
120,195 |
| 2013 |
・・・ |
132,570 |
58,226 |
138,260 |
2,868,872 |
660,078 |
122,890 |
| |
(male) |
・・・ |
86,264
|
48,545 |
16,084 |
1,652,860 |
295,354 |
63,497
|
| |
(female) |
・・・ |
46,306 |
9,681 |
122,176 |
1,216,012 |
364,724 |
59,393 |
| |
(National) |
・・・ |
3,033 |
52,290 |
- |
614,783 |
480 |
- |
| |
(Local) |
・・・ |
128,738 |
3,881 |
7,649 |
146,160 |
26,483 |
796 |
| |
(Private) |
・・・ |
799 |
2,055 |
130,611 |
2,107,929 |
633,115 |
122,094 |
- (1)
- Not including students of correspondence courses
Source:MEXT,School Basic Survey
Teachers
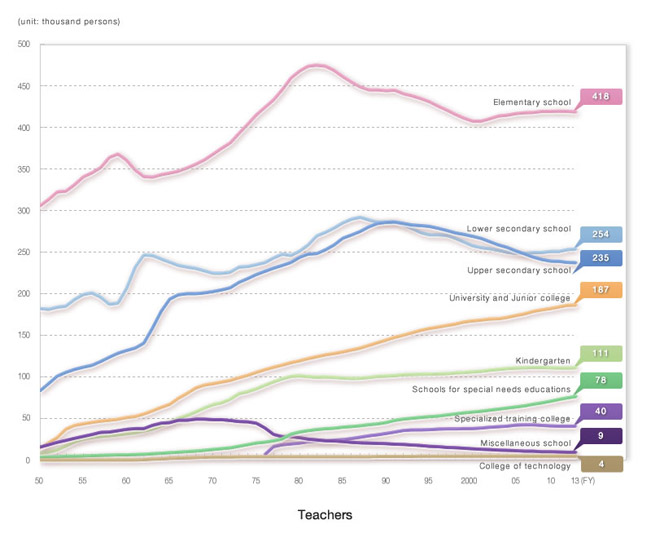
Teachers (1/2)
| (unit : person) |
| FY |
Total |
Kindergarten |
Elementary School |
Lower secondary school |
Upper secondary school |
Secondary school |
School for the blind |
School for the deaf |
| 1950 |
610,411 |
8,028 |
305,520 |
182,008 |
82,932 |
・・・ |
1,168 |
1,791 |
| 1960 |
823,303 |
31,330 |
360,660 |
205,988 |
131,719 |
・・・ |
2,055 |
3,501 |
| 1970 |
1,016,925 |
66,579 |
367,941 |
224,546 |
202,440 |
・・・ |
2,682 |
4,337 |
| 1980 |
1,267,044 |
100,958 |
467,953 |
251,279 |
243,592 |
・・・ |
3,363 |
4,755 |
| 1990 |
1,361,434 |
100,932 |
444,218 |
286,065 |
286,006 |
・・・ |
3,381 |
4,605 |
| 1995 |
1,353,209 |
102,992 |
430,958 |
271,020 |
281,117 |
・・・ |
3,528 |
4,830 |
| 2000 |
1,320,810 |
106,067 |
407,598 |
257,605 |
269,027 |
124 |
3,459 |
4,877 |
| 2005 |
1,322,460 |
110,393 |
416,833 |
248,694 |
251,408 |
560 |
3,383 |
4,974 |
| 2006 |
1,323,418 |
110,807 |
417,858 |
248,280 |
247,804 |
818 |
3,323 |
4,908 |
| 2007 |
1,326,480 |
111,239 |
418,246 |
249,645 |
243,953 |
1,148 |
・・・ |
・・・ |
| 2008 |
1,327,655 |
111,223 |
419,309 |
249,509 |
241,226 |
1,369 |
・・・ |
・・・ |
| 2009 |
1,329,561 |
110,692 |
419,518 |
250,771 |
239,342 |
1,576 |
・・・ |
・・・ |
| 2010 |
1,333,019 |
110,580 |
419,776 |
250,899 |
238,929 |
1,893 |
・・・ |
・・・ |
| 2011 |
1,337,391 |
110,402 |
419,467 |
253,104 |
237,526 |
2,046 |
・・・ |
・・・ |
| 2012 |
1,339,300 |
110,836 |
418,707 |
253,753 |
237,224 |
2,192 |
・・・ |
・・・ |
| 2013 |
1,338,854 |
111,111 |
417,553 |
254,235 |
235,062 |
2,369 |
・・・ |
・・・ |
| |
(male) |
677,795 |
7,373 |
156,444 |
146,114 |
162,968 |
1,604 |
・・・ |
・・・ |
| |
(female) |
661,059 |
103,738 |
261,109 |
108,121 |
72,094 |
765 |
・・・ |
・・・ |
| |
(National) |
73,309 |
360 |
1,843 |
1,629 |
575 |
203 |
・・・ |
・・・ |
| |
(Local) |
940,915 |
23,793 |
410,928 |
237,568 |
174,716 |
1,453 |
・・・ |
・・・ |
| |
(Private) |
324,630 |
86,958 |
4,782 |
15,038 |
59,771 |
713 |
・・・ |
・・・ |
Teachers (2/2)
| (unit : person) |
| FY |
School for the other disabled |
Schools for special needs education |
College of technology |
Junior college |
University |
Specialized training college |
Miscellaneous school |
| 1950 |
15 |
・・・ |
・・・ |
2,124 |
11,534 |
・・・ |
15,291 |
| 1960 |
534 |
・・・ |
・・・ |
6,394 |
44,434 |
・・・ |
36,688 |
| 1970 |
5,310 |
・・・ |
3,245 |
15,320 |
76,275 |
・・・ |
48,175 |
| 1980 |
25,373 |
・・・ |
3,721 |
16,372 |
102,989 |
20,211 |
26,478 |
| 1990 |
36,812 |
・・・ |
4,003 |
20,489 |
123,838 |
31,773 |
19,312 |
| 1995 |
43,555 |
・・・ |
4,306 |
20,702 |
137,464 |
36,433 |
16,304 |
| 2000 |
49,211 |
・・・ |
4,459 |
16,752 |
150,563 |
37,656 |
13,412 |
| 2005 |
55,275 |
・・・ |
4,469 |
11,960 |
161,690 |
41,776 |
11,045 |
| 2006 |
56,826 |
・・・ |
4,471 |
11,278 |
164,473 |
42,171 |
10,401 |
| 2007 |
・・・ |
66,807 |
4,453 |
11,022 |
167,636 |
42,103 |
10,228 |
| 2008 |
・・・ |
68,677 |
4,432 |
10,521 |
169,914 |
41,602 |
9,873 |
| 2009 |
・・・ |
70,518 |
4,400 |
10,128 |
172,039 |
40,922 |
9,655 |
| 2010 |
・・・ |
72,803 |
4,373 |
9,657 |
174,403 |
40,416 |
9,290 |
| 2011 |
・・・ |
74,854 |
4,357 |
9,274 |
176,684 |
40,509 |
9,168 |
| 2012 |
・・・ |
76,387 |
4,337 |
8,916 |
177,570 |
40,424 |
8,954 |
| 2013 |
・・・ |
77,663 |
4,336 |
8,631 |
178,669 |
40,380 |
8,845 |
| |
(male) |
・・・ |
30,803 |
3,980 |
4,201 |
139,639 |
19,373 |
5,296 |
| |
(female) |
・・・ |
46,860 |
356 |
4,430 |
39,030 |
21,007 |
3,549 |
| |
(National) |
・・・ |
1,506 |
3,874 |
- |
63,218 |
101 |
- |
| |
(Local) |
・・・ |
75,865 |
302 |
544 |
12,871 |
2,824 |
51 |
| |
(Private) |
・・・ |
292 |
160 |
8,087 |
102,580 |
37,455 |
8,794 |
- (1)
- Not including teachers of correspondence courses
Source:MEXT,School Basic Survey
New Entrants
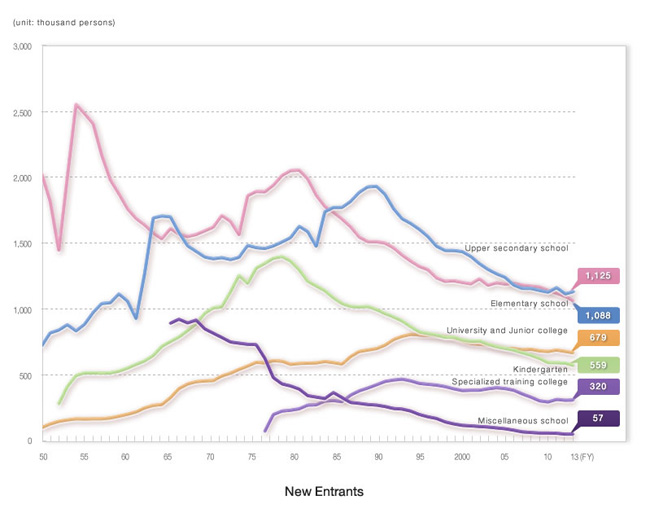
New Entrants (1/2)
| (unit : person) |
| FY |
Kindergarten |
Elementary School |
Upper secondary school |
College of technology |
Junior college |
University |
| 1950 |
183,052 |
2,026,613 |
722,736 |
・・・ |
12,646 |
91,472 |
| 1960 |
555,356 |
1,760,960 |
1,060,423 |
・・・ |
42,318 |
162,922 |
| 1970 |
1,011,640 |
1,621,635 |
1,381,998 |
10,318 |
126,659 |
333,037 |
| 1980 |
1,299,741 |
2,055,669 |
1,628,069 |
9,729 |
178,215 |
412,437 |
| 1990 |
968,422 |
1,501,786 |
1,871,333 |
11,127 |
235,195 |
492,340 |
| 1995 |
818,048 |
1,300,033 |
1,551,685 |
11,313 |
232,741 |
568,576 |
| 2000 |
759,342 |
1,192,258 |
1,400,228 |
11,225 |
141,491 |
599,655 |
| 2005 |
692,013 |
1,199,756 |
1,183,689 |
11,345 |
99,431 |
603,760 |
| 2006 |
671,531 |
1,181,519 |
1,157,291 |
11,330 |
90,740 |
603,054 |
| 2007 |
653,656 |
1,176,236 |
1,158,117 |
11,112 |
84,596 |
613,613 |
| 2008 |
630,169 |
1,169,396 |
1,143,843 |
11,288 |
77,339 |
607,159 |
| 2009 |
596,466 |
1,142,706 |
1,130,034 |
11,280 |
73,163 |
608,731 |
| 2010 |
596,586 |
1,122,283 |
1,165,758 |
10,936 |
72,047 |
619,119 |
| 2011 |
591,458 |
1,097,148 |
1,118,144 |
10,873 |
68,432 |
612,858 |
| 2012 |
574,998 |
1,061,279 |
1,134,515 |
10,994 |
64,063 |
605,390 |
| 2013 |
559,259 |
1,088,481 |
1,125,329 |
10,856 |
64,653 |
614,183 |
| |
(male) |
283,186 |
556,660 |
568,539 |
8,901 |
7,165 |
339,501 |
| |
(female) |
276,073 |
531,821 |
556,790 |
1,955 |
57,488 |
274,682 |
| |
(National) |
2,283 |
6,588 |
2,875 |
9,685 |
- |
100,940 |
| |
(Local) |
128,939 |
1,069,053 |
770,288 |
715 |
3,431 |
30,044 |
| |
(Private) |
428,037 |
12,840 |
352,166 |
456 |
61,222 |
483,199 |
New Entrants (2/2)
| (unit : person) |
| FY |
Graduate school |
Specialized training college |
Miscellaneous school |
| Master's course |
Doctor's course |
Professional Degree course |
| 1950 |
・・・ |
・・・ |
・・・ |
・・・ |
・・・ |
| 1960 |
3,460 |
2,223 |
・・・ |
・・・ |
・・・ |
| 1970 |
12,357 |
3,336 |
・・・ |
・・・ |
818,433 |
| 1980 |
16,844 |
4,669 |
・・・ |
245,849 |
394,792 |
| 1990 |
30,733 |
7,813 |
・・・ |
454,122 |
263,058 |
| 1995 |
53,842 |
13,074 |
・・・ |
431,795 |
185,723 |
| 2000 |
70,336 |
17,023 |
・・・ |
386,471 |
117,098 |
| 2005 |
77,557 |
17,553 |
5,969 |
386,836 |
84,048 |
| 2006 |
77,851 |
17,131 |
8,899 |
358,241 |
71,540 |
| 2007 |
77,451 |
16,926 |
9,059 |
334,417 |
67,109 |
| 2008 |
77,396 |
16,271 |
9,468 |
306,225 |
64,053 |
| 2009 |
78,119 |
15,901 |
9,247 |
297,730 |
62,332 |
| 2010 |
82,310 |
16,471 |
8,931 |
318,324 |
60,741 |
| 2011 |
79,385 |
15,685 |
8,073 |
312,371 |
55,533 |
| 2012 |
74,985 |
15,557 |
7,545 |
313,321 |
54,182 |
| 2013 |
73,353 |
15,491 |
7,208 |
319,527 |
56,823 |
| |
(male) |
51,983 |
10,681 |
5,133 |
148,373 |
31,951 |
| |
(female) |
21,370 |
4,810 |
2,075 |
171,154 |
24,872 |
| |
(National) |
42,902 |
10,230 |
2,639 |
193 |
- |
| |
(Local) |
4,837 |
1,086 |
325 |
9,968 |
591 |
| |
(Private) |
25,614 |
4,175 |
4,244 |
309,366 |
56,232 |
Source:MEXT,School Basic Survey
New Graduates
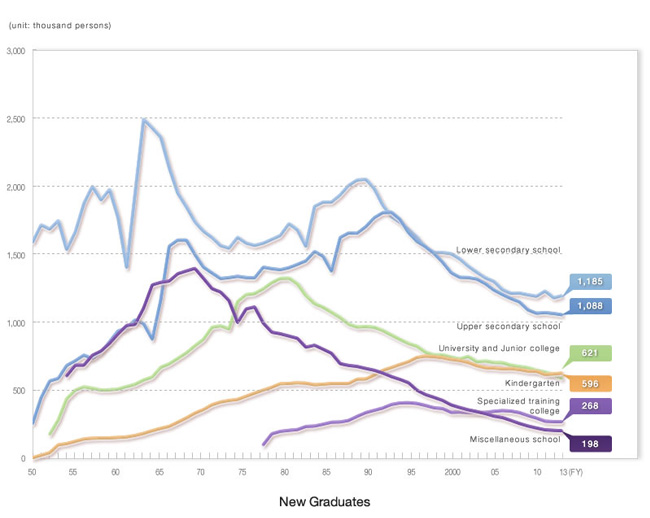
New Graduates (1/2)
| (unit : person) |
| FY |
Kindergarten |
Lower secondary school |
Upper secondary school |
Secondary school |
Special ed.sch. |
| Lower division |
Upper division |
Lower sec.dept. |
Upper sec.dept |
| 1950 |
180,221 |
1,588,227 |
253,278 |
・・・ |
・・・ |
947 |
507 |
| 1960 |
506,150 |
1,770,483 |
933,738 |
・・・ |
・・・ |
2,954 |
1,592 |
| 1970 |
872,088 |
1,667,064 |
1,402,962 |
・・・ |
・・・ |
5,220 |
2,622 |
| 1980 |
1,323,137 |
1,723,025 |
1,399,292 |
・・・ |
・・・ |
7,168 |
5,020 |
| 1990 |
961,842 |
1,981,503 |
1,766,917 |
・・・ |
・・・ |
9,042 |
10,301 |
| 1995 |
822,209 |
1,622,198 |
1,590,720 |
・・・ |
・・・ |
7,307 |
10,717 |
| 2000 |
728,334 |
1,464,760 |
1,328,902 |
40 |
38 |
6,943 |
11,223 |
| 2005 |
700,745 |
1,236,363 |
1,202,738 |
931 |
513 |
7,276 |
13,022 |
| 2006 |
682,082 |
1,211,242 |
1,171,501 |
1,257 |
586 |
7,333 |
13,853 |
| 2007 |
672,925 |
1,213,709 |
1,147,159 |
2,134 |
949 |
7,680 |
14,284 |
| 2008 |
662,958 |
1,199,309 |
1,088,170 |
2,625 |
1,018 |
8,034 |
14,417 |
| 2009 |
644,771 |
1,188,032 |
1,063,581 |
3,178 |
1,831 |
8,345 |
14,966 |
| 2010 |
631,221 |
1,227,736 |
1,069,129 |
3,381 |
2,293 |
8,948 |
16,073 |
| 2011 |
611,036 |
1,176,923 |
1,061,564 |
3,915 |
2,510 |
9,103 |
16,854 |
| 2012 |
584,417 |
1,195,204 |
1,053,180 |
4,773 |
3,207 |
9,280 |
17,707 |
| 2013 |
595,976 |
1,185,054 |
1,088,124 |
5,208 |
3,490 |
9,568 |
19,439 |
| |
(male) |
301,652 |
605,345 |
547,355 |
2,494 |
1,707 |
6,242 |
12,568 |
| |
(female) |
294,324 |
579,709 |
540,769 |
2,714 |
1,783 |
3,326 |
6,871 |
| |
(National) |
2312 |
10,512 |
2,859 |
549 |
355 |
276 |
404 |
| |
(Local) |
134,065 |
1,091,777 |
759,801 |
3,345 |
1,956 |
9,252 |
18,950 |
| |
(Private) |
459,599 |
82,765 |
325,464 |
1,314 |
1,179 |
40 |
85 |
New Graduates (2/2)
| (unit : person) |
| FY |
College of technology |
Junior college |
University |
Graduate school |
Specialized training college |
Miscellaneous school |
| Master's course |
Doctor's course |
Professional Degree course |
| 1950 |
・・・ |
・・・ |
1,858 |
・・・ |
・・・ |
・・・ |
・・・ |
415,043 |
| 1960 |
・・・ |
30,401 |
119,809 |
3,553 |
・・・ |
・・・ |
・・・ |
912,042 |
| 1970 |
6,245 |
114,803 |
240,921 |
9,415 |
3,152 |
・・・ |
・・・ |
1,320,345 |
| 1980 |
7,951 |
169,930 |
378,666 |
15,258 |
3,614 |
・・・ |
202,738 |
895,973 |
| 1990 |
9,038 |
208,358 |
400,103 |
25,804 |
5,812 |
・・・ |
350,360 |
645,098 |
| 1995 |
10,189 |
246,474 |
493,277 |
41,681 |
8,019 |
・・・ |
401,317 |
497,953 |
| 2000 |
9,849 |
177,909 |
538,683 |
56,038 |
12,375 |
・・・ |
336,770 |
371,582 |
| 2005 |
10,061 |
104,621 |
551,016 |
71,440 |
15,286 |
649 |
348,251 |
296,753 |
| 2006 |
10,140 |
99,611 |
558,184 |
72,531 |
15,973 |
3,524 |
344,538 |
276,376 |
| 2007 |
10,207 |
92,100 |
559,090 |
73,993 |
16,801 |
6,777 |
333,863 |
254,159 |
| 2008 |
10,160 |
83,900 |
555,690 |
73,881 |
16,281 |
8,034 |
310,443 |
234,655 |
| 2009 |
10,474 |
78,056 |
559,539 |
73,811 |
16,463 |
8,292 |
292,798 |
218,971 |
| 2010 |
10,126 |
71,394 |
541,428 |
73,220 |
15,842 |
8,669 |
270,328 |
206,914 |
| 2011 |
10,155 |
66,871 |
552,358 |
74,680 |
15,892 |
8,812 |
266,035 |
202,383 |
| 2012 |
10,163 |
65,682 |
558,692 |
78,711 |
16,260 |
8,562 |
267,350 |
199,035 |
| 2013 |
10,101 |
62,375 |
558,853 |
76,511 |
16,445 |
8,001 |
268,292 |
197,961 |
| |
(male) |
8,515 |
6,345 |
308,817 |
53,916 |
11,508 |
5,780 |
124,474 |
118,160 |
| |
(female) |
1,586 |
56,030 |
250,036 |
22,595 |
4,937 |
2,221 |
143,818 |
79,801 |
| |
(National) |
9,050 |
- |
100,134 |
43,349 |
11,511 |
2,707 |
205 |
- |
| |
(Local) |
688 |
3,476 |
27,895 |
4,774 |
885 |
325 |
9,425 |
1,095 |
| |
(Private) |
363 |
58,899 |
430,824 |
28,388 |
4,049 |
4,969 |
258,662 |
196,866 |
Source:MEXT,School Basic Survey
Enrollment and Advancement Rate
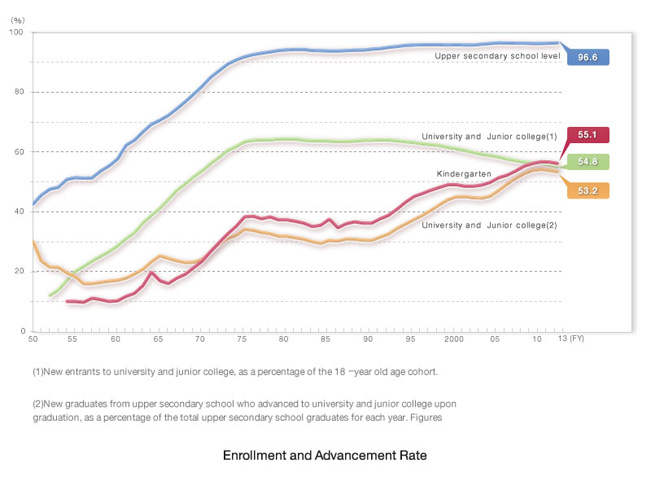
- (1)
- New entrants to university and junior college, as a percentage of the 18-year old age cohort.
- (2)
- New graduates from upper secondary school who advanced to university and junior college upon graduation, as a percentage of the total upper secondary school graduates for each year.
Figures include new graduates of upper division of secondary schools.
Enrollment and Advancement Rate (1/3)
| (unit : %) |
| FY |
Kindergarten(1) |
Compulsory education |
Upper secondary school level |
|
Upper secondary school(2) |
| Elem.sch. |
Lower sec.sch. |
Total |
Male |
Female |
Total |
Male |
Female |
| 1950 |
8.9 |
99.64 |
99.20 |
・・・ |
・・・ |
・・・ |
42.5 |
48.0 |
36.7 |
| 1960 |
28.7 |
99.82 |
99.93 |
・・・ |
・・・ |
・・・ |
57.7 |
59.6 |
55.9 |
| 1970 |
53.8 |
99.83 |
99.89 |
・・・ |
・・・ |
・・・ |
82.1 |
81.6 |
82.7 |
| 1980 |
64.4 |
99.98 |
99.98 |
・・・ |
・・・ |
・・・ |
94.2 |
93.1 |
95.4 |
| 1990 |
64.0 |
99.99 |
99.99 |
95.1 |
94.0 |
96.2 |
94.4 |
93.2 |
95.6 |
| 1995 |
63.2 |
99.99 |
99.99 |
96.7 |
95.8 |
97.6 |
95.8 |
94.7 |
97.0 |
| 2000 |
61.1 |
99.98 |
99.98 |
97.0 |
96.3 |
97.7 |
95.9 |
95.0 |
96.8 |
| 2005 |
58.4 |
99.97 |
99.98 |
97.6 |
97.3 |
97.9 |
96.5 |
96.1 |
96.8 |
| 2006 |
57.7 |
99.97 |
99.98 |
97.7 |
97.4 |
98.0 |
96.5 |
96.2 |
96.8 |
| 2007 |
57.2 |
99.97 |
99.98 |
97.7 |
97.4 |
98.0 |
96.4 |
96.1 |
96.6 |
| 2008 |
56.7 |
99.96 |
99.97 |
97.8 |
97.6 |
98.1 |
96.4 |
96.2 |
96.6 |
| 2009 |
56.4 |
99.96 |
99.97 |
97.9 |
97.7 |
98.2 |
96.3 |
96.2 |
96.5 |
| 2010 |
56.2 |
99.96 |
99.97 |
98.0 |
97.8 |
98.3 |
96.3 |
96.1 |
96.5 |
| 2011 |
55.7 |
99.95 |
99.96 |
98.2 |
98.0 |
98.5 |
96.4 |
96.2 |
96.7 |
| 2012 |
55.1 |
99.95 |
99.96 |
98.3 |
98.0 |
98.6 |
96.5 |
96.2 |
96.8 |
| 2013 |
54.8 |
99.96 |
99.96 |
98.4 |
98.1 |
98.7 |
96.6 |
96.2 |
96.9 |
- (1)
- Kindergarten graduates as a percentage of enrollment in the 1st year of elementary school.
- (2)
- Excluding those advancing to correspondence courses of upper secondary schools. Figures include completion numbers of lower division of secondary school.
Enrollment and Advancement Rate (2/3)
| (unit : %) |
| FY |
University & Junior college(3) |
Specialized training college |
|
University & Junior college(4) |
| Total |
Male |
Female |
Total |
Male |
Female |
Total |
Male |
Female |
| 1950 |
・・・ |
・・・ |
・・・ |
30.3 |
34.6 |
17.2 |
・・・ |
・・・ |
・・・ |
| 1960 |
・・・ |
・・・ |
・・・ |
17.2 |
19.7 |
14.2 |
・・・ |
・・・ |
・・・ |
| 1970 |
・・・ |
・・・ |
・・・ |
24.2 |
25.0 |
23.5 |
・・・ |
・・・ |
・・・ |
| 1980 |
・・・ |
・・・ |
・・・ |
31.9 |
30.3 |
33.5 |
8.6 |
6.6 |
10.5 |
| 1990 |
30.6 |
23.8 |
37.3 |
30.5 |
23.8 |
37.2 |
15.8 |
14.9 |
16.7 |
| 1995 |
37.6 |
29.7 |
45.4 |
37.5 |
29.6 |
45.4 |
16.7 |
16.0 |
17.4 |
| 2000 |
45.1 |
42.6 |
47.6 |
45.1 |
42.6 |
47.6 |
17.2 |
15.0 |
19.3 |
| 2005 |
47.3 |
45.9 |
48.7 |
47.2 |
45.9 |
48.6 |
19.0 |
16.1 |
22.0 |
| 2006 |
49.4 |
48.1 |
50.6 |
49.3 |
48.1 |
50.6 |
18.2 |
15.1 |
21.4 |
| 2007 |
51.2 |
50.0 |
52.5 |
51.2 |
49.9 |
52.4 |
16.8 |
13.5 |
20.2 |
| 2008 |
52.9 |
51.4 |
54.4 |
52.8 |
51.4 |
54.3 |
15.3 |
12.0 |
18.8 |
| 2009 |
53.9 |
52.3 |
55.6 |
53.9 |
52.3 |
55.5 |
14.7 |
11.3 |
18.1 |
| 2010 |
54.3 |
52.8 |
56.0 |
54.3 |
52.7 |
55.9 |
15.9 |
12.7 |
19.2 |
| 2011 |
53.9 |
51.9 |
55.9 |
53.9 |
51.9 |
55.9 |
16.2 |
12.9 |
19.5 |
| 2012 |
53.6 |
51.6 |
55.6 |
53.5 |
51.6 |
55.5 |
16.8 |
13.5 |
20.2 |
| 2013 |
53.2 |
50.9 |
55.6 |
53.2 |
50.9 |
55.5 |
17.0 |
13.6 |
20.4 |
- (3)
- New graduates from upper secondary school who advanced to university and junior college upon graduation, as a percentage of the total upper secondary school graduates for each year. Figures include new graduates of upper division of secondary schools.
- (4)
- Excluding those advancing to correspondence courses of universities and junior colleges.
Enrollment and Advancement Rate (3/3)
| (unit : %) |
| FY |
University & Junior college(5) |
University(6) |
Junior college(7) |
| Total |
Male |
Female |
Total |
Male |
Female |
Total |
Male |
Female |
| 1950 |
・・・ |
・・・ |
・・・ |
・・・ |
・・・ |
・・・ |
・・・ |
・・・ |
・・・ |
| 1960 |
10.3 |
14.9 |
5.5 |
8.2 |
13.7 |
2.5 |
2.1 |
1.2 |
3.0 |
| 1970 |
23.6 |
29.2 |
17.7 |
17.1 |
27.3 |
6.5 |
6.5 |
2.0 |
11.2 |
| 1980 |
37.4 |
41.3 |
33.3 |
26.1 |
39.3 |
12.3 |
11.3 |
2.0 |
21.0 |
| 1990 |
36.3 |
35.2 |
37.4 |
24.6 |
33.4 |
15.2 |
11.7 |
1.7 |
22.2 |
| 1995 |
45.2 |
42.9 |
47.6 |
32.1 |
40.7 |
22.9 |
13.1 |
2.1 |
24.6 |
| 2000 |
49.1 |
49.4 |
48.7 |
39.7 |
47.5 |
31.5 |
9.4 |
1.9 |
17.2 |
| 2005 |
51.5 |
53.1 |
49.8 |
44.2 |
51.3 |
36.8 |
7.3 |
1.8 |
13.0 |
| 2006 |
52.3 |
53.7 |
51.0 |
45.5 |
52.1 |
38.5 |
6.8 |
1.5 |
12.4 |
| 2007 |
53.7 |
54.9 |
52.5 |
47.2 |
53.5 |
40.6 |
6.5 |
1.4 |
11.9 |
| 2008 |
55.3 |
56.5 |
54.1 |
49.1 |
55.2 |
42.6 |
6.3 |
1.3 |
11.5 |
| 2009 |
56.2 |
57.2 |
55.3 |
50.2 |
55.9 |
44.2 |
6.0 |
1.2 |
11.1 |
| 2010 |
56.8 |
57.7 |
56.0 |
50.9 |
56.4 |
45.2 |
5.9 |
1.3 |
10.8 |
| 2011 |
56.7 |
57.2 |
56.1 |
51.0 |
56.0 |
45.8 |
5.7 |
1.2 |
10.4 |
| 2012 |
56.2 |
56.8 |
55.6 |
50.8 |
55.6 |
45.8 |
5.4 |
1.2 |
9.8 |
| 2013 |
55.1 |
55.1 |
55.2 |
49.9 |
54.0 |
45.6 |
5.3 |
1.1 |
9.5 |
- (5)
- New entrants to university and junior college, as a percentage of the 18-year old age cohort.
- (6)
- New entrants to university as a percentage of the 18-year old age cohort.
- (7)
- New entrants to junior college as a percentage of the 18-year old age cohort.
Source:MEXT,School Basic Survey
Percentage of New Graduates Entering Employment
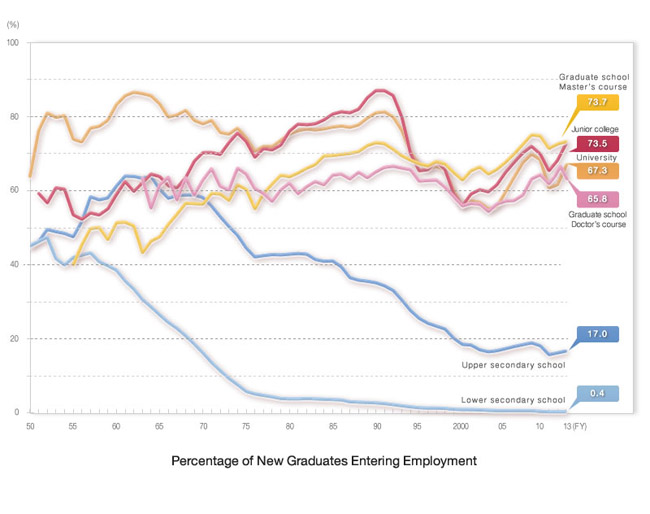
Percentage of New Graduates Entering Employment (1/2)
| (unit : %) |
| FY |
Lower secondary school |
Upper secondary school |
College of technology |
Junior college |
| Total |
Male |
Female |
Total |
Male |
Female |
Total |
Male |
Female |
Total |
Male |
Female |
| 1950 |
45.2 |
46.2 |
44.1 |
44.9 |
47.9 |
35.7 |
・・・ |
・・・ |
・・・ |
・・・ |
・・・ |
・・・ |
| 1960 |
38.6 |
39.7 |
37.5 |
61.3 |
63.7 |
58.6 |
・・・ |
・・・ |
・・・ |
58.9 |
79.5 |
49.8 |
| 1970 |
16.3 |
16.5 |
16.1 |
58.2 |
55.4 |
61.2 |
96.7 |
96.8 |
94.4 |
70.3 |
80.5 |
68.8 |
| 1980 |
3.9 |
4.5 |
3.2 |
42.9 |
40.2 |
45.6 |
89.1 |
89.0 |
92.6 |
76.0 |
71.8 |
76.4 |
| 1990 |
2.8 |
3.7 |
1.8 |
35.2 |
34.2 |
36.2 |
85.9 |
85.6 |
92.3 |
87.0 |
72.9 |
88.1 |
| 1995 |
1.5 |
2.2 |
0.9 |
25.6 |
27.9 |
23.4 |
74.2 |
73.6 |
78.5 |
65.4 |
57.3 |
66.0 |
| 2000 |
1.0 |
1.5 |
0.5 |
18.6 |
20.7 |
16.5 |
59.7 |
58.4 |
65.1 |
56.0 |
41.3 |
57.4 |
| 2005 |
0.7 |
1.0 |
0.4 |
17.4 |
19.8 |
14.9 |
53.8 |
52.3 |
60.4 |
65.0 |
50.6 |
66.8 |
| 2006 |
0.7 |
1.0 |
0.4 |
18.0 |
20.5 |
15.4 |
53.8 |
51.8 |
63.2 |
67.7 |
52.1 |
69.8 |
| 2007 |
0.7 |
1.0 |
0.4 |
18.5 |
21.2 |
15.8 |
54.3 |
52.3 |
64.2 |
70.2 |
54.0 |
72.3 |
| 2008 |
0.7 |
0.9 |
0.4 |
19.0 |
21.8 |
16.1 |
54.2 |
52.1 |
64.4 |
72.0 |
55.9 |
74.0 |
| 2009 |
0.5 |
0.7 |
0.3 |
18.2 |
21.1 |
15.2 |
53.6 |
51.6 |
63.6 |
69.9 |
53.1 |
71.9 |
| 2010 |
0.4 |
0.6 |
0.2 |
15.8 |
18.4 |
13.1 |
51.5 |
49.2 |
63.9 |
65.4 |
48.0 |
67.3 |
| 2011 |
0.4 |
0.6 |
0.2 |
16.3 |
19.4 |
13.3 |
54.3 |
52.9 |
61.8 |
68.2 |
49.5 |
70.1 |
| 2012 |
0.4 |
0.6 |
0.2 |
16.8 |
20.0 |
13.6 |
57.6 |
56.1 |
65.5 |
70.8 |
52.1 |
72.9 |
| 2013 |
0.4 |
0.6 |
0.2 |
17.0 |
20.3 |
13.6 |
58.0 |
56.2 |
67.5 |
73.5 |
54.0 |
75.7 |
- (1)
- Including those undertaking further education while in employment.
Percentage of New Graduates Entering Employment (2/2)
| (unit : %) |
| FY |
University |
Graduate school |
| Master's course |
Doctor's course |
Professional Degree course |
| Total |
Male |
Female |
Total |
Male |
Female |
Total |
Male |
Female |
Total |
Male |
Female |
| 1950 |
63.8 |
64.1 |
45.2 |
・・・ |
・・・ |
・・・ |
・・・ |
・・・ |
・・・ |
・・・ |
・・・ |
・・・ |
| 1960 |
83.2 |
86.3 |
64.1 |
51.4 |
52.7 |
32.9 |
・・・ |
・・・ |
・・・ |
・・・ |
・・・ |
・・・ |
| 1970 |
78.1 |
82.8 |
59.9 |
56.4 |
58.1 |
37.1 |
62.9 |
63.6 |
51.7 |
・・・ |
・・・ |
・・・ |
| 1980 |
75.3 |
78.5 |
65.7 |
63.8 |
67.2 |
36.2 |
62.1 |
63.9 |
40.0 |
・・・ |
・・・ |
・・・ |
| 1990 |
81.0 |
81.0 |
81.0 |
73.0 |
76.8 |
49.6 |
65.1 |
67.4 |
48.4 |
・・・ |
・・・ |
・・・ |
| 1995 |
67.1 |
68.7 |
63.7 |
67.3 |
72.1 |
46.6 |
62.6 |
64.9 |
50.0 |
・・・ |
・・・ |
・・・ |
| 2000 |
55.8 |
55.0 |
57.1 |
62.9 |
68.3 |
46.6 |
55.9 |
58.6 |
45.2 |
・・・ |
・・・ |
・・・ |
| 2005 |
59.7 |
56.6 |
64.1 |
67.7 |
72.6 |
55.2 |
57.2 |
59.9 |
49.8 |
76.9 |
80.0 |
67.5 |
| 2006 |
63.7 |
60.5 |
68.1 |
70.0 |
74.8 |
58.2 |
57.4 |
60.3 |
49.3 |
33.0 |
34.8 |
27.2 |
| 2007 |
67.6 |
64.0 |
72.3 |
72.5 |
77.0 |
61.7 |
58.8 |
61.7 |
50.8 |
26.6 |
28.9 |
20.3 |
| 2008 |
69.9 |
66.4 |
74.6 |
75.1 |
79.6 |
64.6 |
63.2 |
66.3 |
55.0 |
30.5 |
32.5 |
25.2 |
| 2009 |
68.4 |
64.6 |
73.4 |
74.8 |
79.4 |
63.9 |
64.3 |
67.8 |
54.7 |
30.5 |
32.1 |
26.5 |
| 2010 |
60.8 |
56.4 |
66.6 |
71.4 |
76.0 |
60.7 |
61.9 |
65.4 |
53.2 |
34.8 |
36.1 |
31.2 |
| 2011 |
61.6 |
57.0 |
67.6 |
72.6 |
77.1 |
61.6 |
63.9 |
67.5 |
55.5 |
37.5 |
38.5 |
34.6 |
| 2012 |
63.9 |
58.9 |
70.2 |
73.3 |
77.9 |
61.5 |
67.3 |
71.8 |
56.5 |
43.1 |
43.6 |
41.7 |
| 2013 |
67.3 |
62.3 |
73.4 |
73.4 |
78.6 |
62.0 |
65.8 |
70.1 |
55.8 |
45.8 |
46.2 |
44.8 |
Source:MEXT,School Basic Survey
Total Floor Spaces of School Buildings
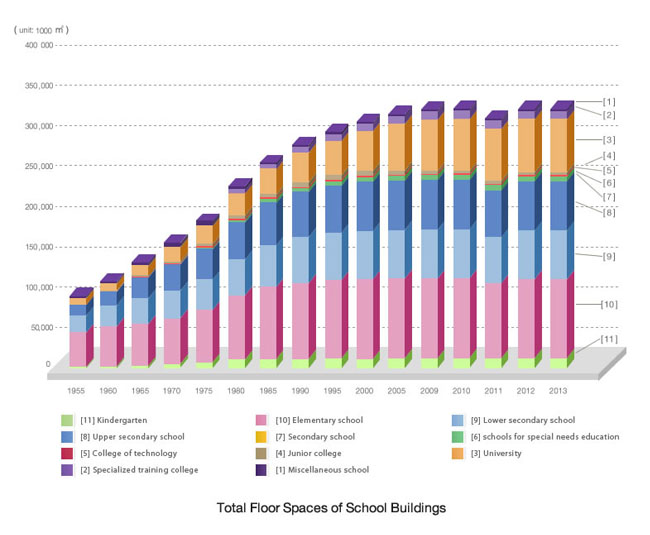
Total Floor Spaces of School Buildings (1/2)
| (unit : 1000m²) |
|
Total |
Kindergarten |
Elementary school |
Lower secondary school |
Upper secondary school |
Secondary school |
School for the blind |
School for the deaf |
| 1955 |
93,948 |
1,522 |
44,773 |
22,267 |
13,697 |
… |
165 |
269 |
| 1960 |
113,468 |
2,286 |
52,164 |
26,907 |
17,983 |
… |
197 |
343 |
| 1965 |
138,492 |
3,291 |
54,713 |
33,211 |
27,248 |
… |
248 |
414 |
| 1970 |
165,115 |
5,217 |
59,831 |
36,104 |
34,152 |
… |
326 |
498 |
| 1975 |
192,521 |
7,450 |
68,606 |
39,945 |
39,712 |
… |
… |
2,120 |
| 1980 |
236,768 |
11,028 |
84,225 |
46,850 |
47,775 |
… |
… |
3,366 |
| 1985 |
269,301 |
11,691 |
94,862 |
54,754 |
55,732 |
… |
… |
4,187 |
| 1990 |
291,301 |
12,037 |
99,100 |
59,296 |
59,736 |
… |
… |
4,659 |
| 1995 |
308,468 |
12,594 |
102,389 |
61,692 |
62,068 |
… |
… |
5,097 |
| 2000 |
321,412 |
12,169 |
103,687 |
63,136 |
64,302 |
25 |
… |
5,608 |
| 2005 |
331,767 |
12,694 |
104,175 |
63,598 |
64,845 |
80 |
… |
5,922 |
| 2006 |
334,250 |
12,642 |
104,175 |
63,843 |
64,682 |
121 |
… |
6,009 |
| 2007 |
336,290 |
12,672 |
104,142 |
63,902 |
65,193 |
142 |
… |
… |
| 2008 |
336,370 |
12,779 |
104,136 |
64,023 |
64,882 |
167 |
… |
… |
| 2009 |
337,701 |
12,815 |
104,042 |
64,094 |
64,759 |
188 |
… |
… |
| 2010 |
339,571 |
12,815 |
103,984 |
64,230 |
64,558 |
226 |
… |
… |
| 2011 |
325,030 |
12,542 |
98,035 |
60,686 |
60,695 |
241 |
… |
… |
| 2012 |
338,122 |
12,706 |
103,199 |
64,036 |
63,838 |
257 |
… |
… |
| 2013 |
339,141 |
12,742 |
102,637 |
63,935 |
63,752 |
258 |
… |
… |
| |
(National) |
26,328 |
47 |
462 |
447 |
146 |
49 |
… |
… |
| |
(Local) |
222,052 |
3,365 |
100,980 |
60,457 |
44,177 |
… |
… |
… |
| |
(Private) |
90,761 |
9,330 |
1,195 |
3,031 |
19,429 |
209 |
… |
… |
Total Floor Spaces of School Buildings (2/2)
| (unit : 1000m²) |
|
School for the other disabled |
schools for special needs education |
College of technology |
Junior college |
University |
Specialized training college |
Miscellaneous school |
Higher education |
| 1955 |
4 |
… |
… |
743 |
8,446 |
… |
2,062 |
9,189 |
| 1960 |
58 |
… |
… |
887 |
9,645 |
… |
2,998 |
10,532 |
| 1965 |
200 |
… |
478 |
1,562 |
13,237 |
… |
3,890 |
15,277 |
| 1970 |
542 |
… |
1,087 |
2,919 |
19,230 |
… |
5,207 |
23,237 |
| 1975 |
… |
… |
1,284 |
3,664 |
23,705 |
… |
6,037 |
28,652 |
| 1980 |
… |
… |
1,386 |
4,283 |
28,977 |
5,266 |
3,612 |
34,646 |
| 1985 |
… |
… |
1,492 |
5,068 |
33,426 |
4,879 |
3,211 |
39,986 |
| 1990 |
… |
… |
1,587 |
6,228 |
38,728 |
7,009 |
2,922 |
46,543 |
| 1995 |
… |
… |
1,682 |
6,588 |
44,678 |
8,331 |
3,349 |
52,948 |
| 2000 |
… |
… |
1,769 |
6,302 |
52,909 |
9,083 |
2,423 |
60,979 |
| 2005 |
… |
… |
1,871 |
4,677 |
61,319 |
10,560 |
2,026 |
67,868 |
| 2006 |
… |
… |
1,856 |
4,141 |
62,632 |
12,226 |
1,924 |
68,630 |
| 2007 |
… |
6,080 |
1,858 |
4,015 |
64,045 |
12,341 |
1,900 |
69,882 |
| 2008 |
… |
6,154 |
1,860 |
3,763 |
65,151 |
11,593 |
1,862 |
70,774 |
| 2009 |
… |
6,273 |
1,862 |
3,648 |
66,607 |
11,581 |
1,832 |
72,117 |
| 2010 |
… |
6,389 |
1,864 |
3,476 |
68,593 |
11,621 |
1,815 |
73,933 |
| 2011 |
… |
6,227 |
1,861 |
3,434 |
68,580 |
10,974 |
1,757 |
73,875 |
| 2012 |
… |
6,617 |
1,860 |
3,224 |
69,643 |
10,960 |
1,782 |
74,727 |
| 2013 |
… |
6,868 |
1,865 |
3,058 |
71,342 |
10,900 |
1,784 |
76,265 |
| |
(National) |
… |
194 |
1,694 |
- |
23,288 |
1 |
- |
24,982 |
| |
(Local) |
… |
6,637 |
122 |
206 |
5,032 |
1,062 |
14 |
5,360 |
| |
(Private) |
… |
37 |
49 |
2,852 |
43,022 |
9,837 |
1,770 |
45,923 |
(Note) Local Secondary schools are parted into Lower secondary school and Upper secondary school by division.
「Total Expenditure and Public Expenditure on Education, relative to Expenditure on Administration and Gross Domestic Product」
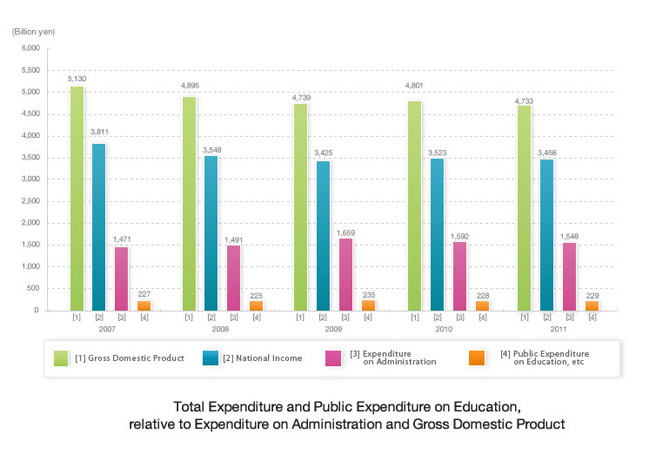
|
(unit: million yen) |
| FY |
(A) Public Expenditure on Education, etc. |
(B) Gross Domestic Product |
A/B (%) |
(C) National Income |
A/C (%) |
(D) Expenditure on Administration |
A/D (%) |
| 2005 |
231,230 |
5,053,494 |
4.58 |
3,740,848 |
6.18 |
1,477,840 |
15.65 |
| 2006 |
224,633 |
5,091,063 |
4.41 |
3,781,903 |
5.94 |
1,426,633 |
15.75 |
| 2007 |
227,317 |
5,130,233 |
4.43 |
3,812,392 |
5.96 |
1,470,982 |
15.45 |
| 2008 |
225,102 |
4,895,201 |
4.60 |
3,550,380 |
6.34 |
1,491,145 |
15.10 |
| 2009 |
234,588 |
4,739,339 |
4.95 |
3,443,848 |
6.81 |
1,659,122 |
14.14 |
| 2010 |
228,177 |
4,800,980 |
4.75 |
3,523,103 |
6.48 |
1,591,605 |
14.34 |
| 2011 |
228,805 |
4,732,826 |
4.83 |
3,467,557 |
6.60 |
1,647,718 |
13.89 |
Total Expenditure on Education by Sphere of Education (FY2011)
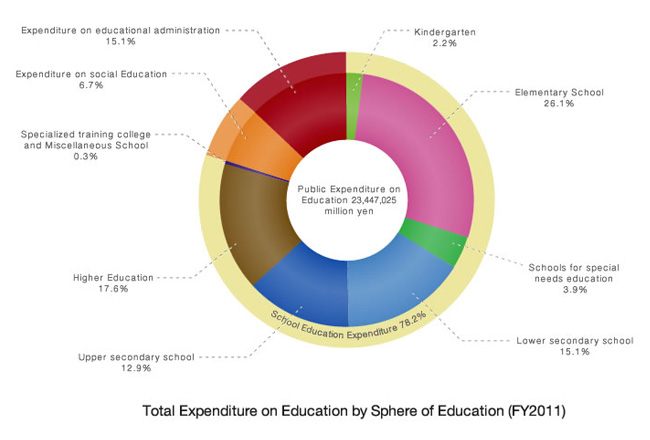
Total Expenditure on Education by Sphere of Education (1/2)
| (unit: million yen) |
| FY |
Public Expenditure on Education |
School Education Expenditure |
| Total |
Kindergarten |
Elementary School |
Schools for special needs education |
Lower secondary school |
| 2005 |
23,122,988 |
18,558,656 |
488,213 |
6,366,493 |
868,127 |
3,556,609 |
| 2006 |
22,463,347 |
18,123,006 |
485,102 |
6,318,792 |
882,167 |
3,521,131 |
| 2007 |
22,731,689 |
18,278,455 |
487,121 |
6,288,213 |
892,327 |
3,545,937 |
| 2008 |
22,510,224 |
18,166,301 |
487,237 |
6,208,208 |
894,824 |
3,517,985 |
| 2009 |
23,458,813 |
18,704,840 |
500,849 |
6,325,447 |
910,339 |
3,603,478 |
| 2010 |
22,817,719 |
18,275,331 |
502,536 |
6,278,396 |
926,999 |
3,611,864 |
| 2011 |
23,447,025 |
18,328,361 |
507,618 |
6,121,110 |
922,835 |
3,541,291 |
Total Expenditure on Education by Sphere of Education (2/2)
| (unit: million yen) |
| FY |
School Education Expenditure |
Expenditure on social Education |
Expenditure on educational administration |
| Upper secondary school |
Higher Education |
Specialized training college and Miscellaneous School |
| 2005 |
3,342,450 |
3,862,696 |
74,070 |
2,043,617 |
2,520,715 |
| 2006 |
3,298,235 |
3,548,912 |
68,666 |
1,861,003 |
2,479,338 |
| 2007 |
3,281,567 |
3,716,131 |
67,160 |
1,803,135 |
2,650,099 |
| 2008 |
3,165,468 |
3,824,818 |
67,761 |
1,711,010 |
2,632,913 |
| 2009 |
3,135,902 |
4,159,450 |
69,375 |
1,729,079 |
3,024,894 |
| 2010 |
3,092,519 |
3,792,179 |
70,838 |
1,640,871 |
2,901,517 |
| 2011 |
3,035,684 |
4,129,497 |
70,326 |
1,574,309 |
3,544,356 |
Number of R&D Performing Institutions and Researchers by kind of organization
|
| FY |
Total |
Business enterprises |
Non-profit institution and Public organization |
University and College |
| Institutions |
researchers |
Institutions |
researchers |
Institutions |
researchers |
Institutions |
researchers |
| 2001 |
27,061 |
728,215 |
22,789 |
421,363 |
1,245 |
47,093 |
3,027 |
259,759 |
| 2002 |
22,056 |
756,336 |
17,903 |
430,688 |
1,138 |
44,938 |
3,015 |
280,710 |
| 2003 |
18,468 |
757,339 |
14,258 |
431,190 |
1,119 |
44,845 |
3,091 |
281,304 |
| 2004 |
29,663 |
787,264 |
25,440 |
458,845 |
1,103 |
44,089 |
3,120 |
284,330 |
| 2005 |
28,608 |
790,932 |
24,290 |
455,868 |
1,089 |
43,917 |
3,229 |
291,147 |
| 2006 |
22,201 |
819,931 |
17,764 |
481,496 |
1,109 |
42,959 |
3,328 |
295,476 |
| 2007 |
23,204 |
826,565 |
18,737 |
483,339 |
1,057 |
42,033 |
3,410 |
301,193 |
| 2008 |
26,908 |
827,291 |
22,370 |
483,728 |
1,040 |
41,071 |
3,498 |
302,492 |
| 2009 |
21,558 |
838,974 |
17,029 |
492,805 |
1,008 |
40,322 |
3,521 |
305,847 |
| 2010 |
18,572 |
840,293 |
14,003 |
490,494 |
994 |
40,812 |
3,575 |
308,987 |
| 2011 |
19,223 |
842,868 |
14,666 |
490,538 |
953 |
40,231 |
3,604 |
312,099 |
| 2012 |
16,248 |
844,430 |
11,677 |
490,920 |
940 |
39,598 |
3,631 |
313,912 |
| 2013 |
17,276 |
835,701 |
12,673 |
481,425 |
965 |
39,032 |
3,638 |
315,244 |
- (1)
- Figures are as of March 31.


