| Home > Policy > White Paper, Notice, Announcement > White Paper > WHITE PAPER ON SCIENCE AND TECHNOLOGY2003 > Part2 2.2 2.2.1 2.2.1.3 | ||
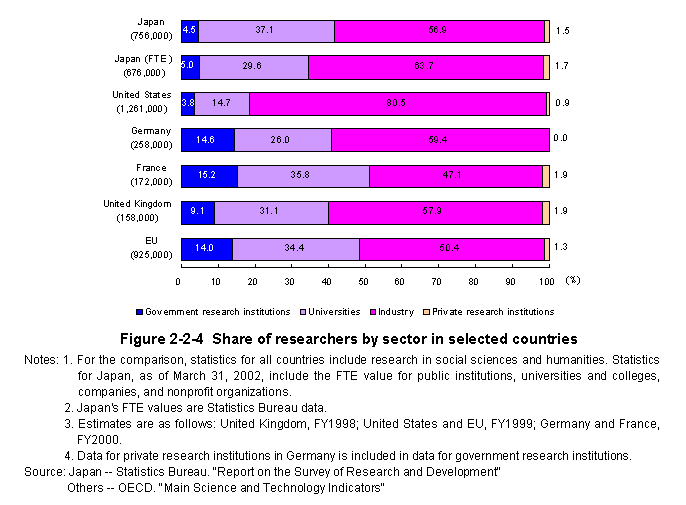
As for the number of researchers by type of organization,industry(companies)has the most in Japan at56.9%(63.7%using FTE)of the total,followed by universities and colleges at37.1%(29.6using FTE)and government research institutions(public institutions)at4.5%(5.0%using FTE).
The United States has a greater percentage of researchers working in industry,and the percentage of researchers in its government research institutions is low,similar to Japan.In Europe,mean-while,research personnel are concentrated to a high degree in government research (Figure2-2-4).
The following sections show the characteristics of researchers in Japan by sector.
| 2.2.1.3.1Business enterprises |
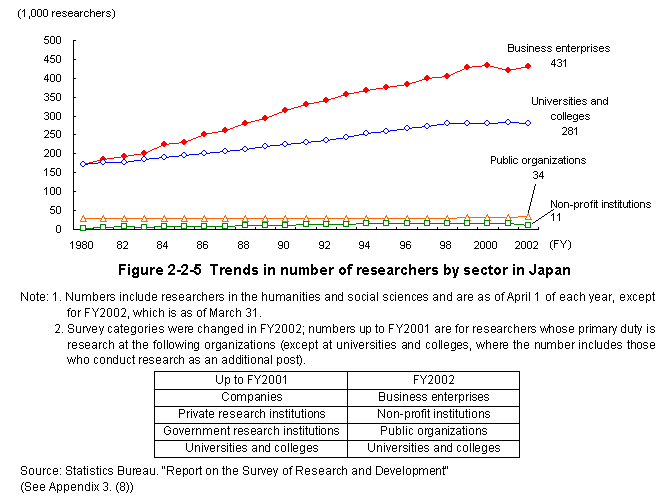
In the last five years from1997to2002(with2002using the revised survey),the number of researchers in business enterprises an average annual rate of increase of1.47%),from400,000researchers to431,000,which,while slowing,is still increasing compared to other organizations.This hints that industry,as well,has come to place great importance on research and development (Figure2-2-5).
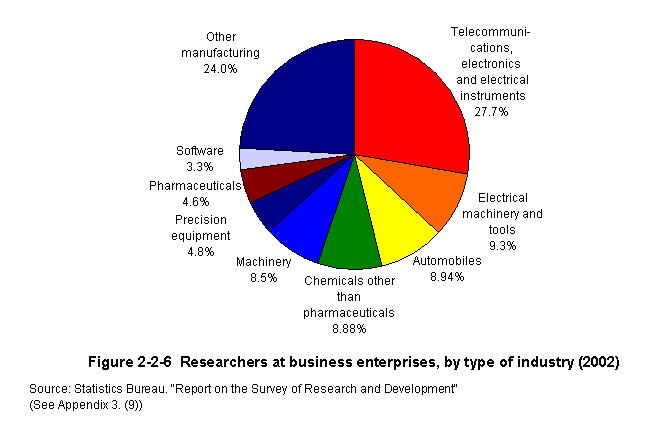
As for the number of researchers by type of industry,the telecommunications,electronics and electrical instrument industry registered the highest number,followed in order by the electrical machinery and the automobile industry,chemicals industry other than pharmaceuticals,(a total of three industries)the machinery industry,the precision equipment industry,the pharmaceuticals industry,and the software industry (Figure2-2-6).
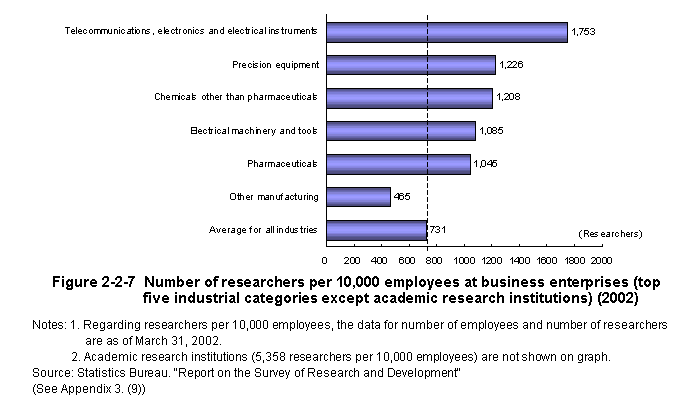
As for the number of researchers out of10,000employees,except for academic research institutions,the telecommunications,electronics and electrical instrument industry had the largest number,at more than2.4times higher than the average for all industries,followed in order by the precision equipment industry,the chemicals industry other than pharmaceuticals(a total of three industries),the electrical machinery and tools industry,and the pharmaceutical industry in all of which more than one employee in10is fully engaged in R&D (Figure2-2-7).
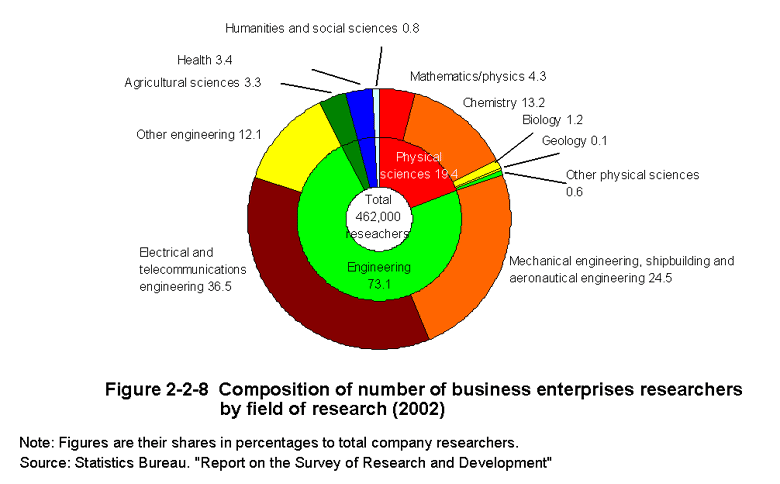
By field of research,engineering ranks the highest.Next is physical science,followed by health,and finally agricultural sciences.Within the engineering field,researchers are concentrated in"electrical and telecommunications engineering,""mechanical engineering,shipbuilding and aero-nautical engineering."Within physical science,chemistry has the majority.These three fields employ more than three-fourths of all Business enterprises researchers (Figure2-2-8).
| 2.2.1.3.2 Non-profit Institutions and Public Organizations |
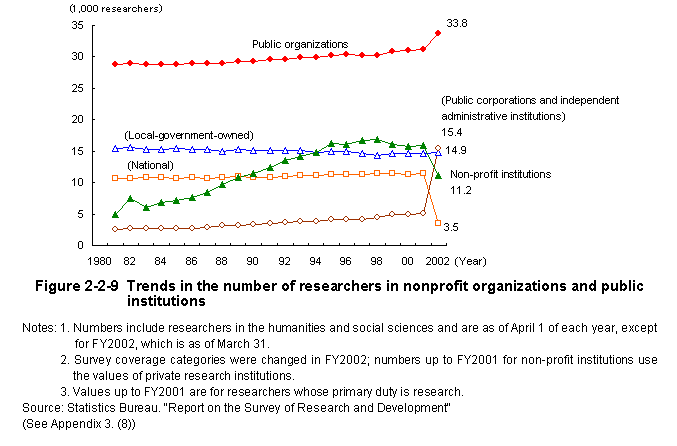
A chronological comparison of the number of researchers is made difficult by the transformation of national experimental research institutions into independent administrative institutions in addition to the revision of the Statistics Bureau's"Survey of Research and Development."However,the number of researchers stands at11,200in non-profit institutions,and within public organizations,at3,500in national institutions,14,900in local government-owned institutions,and15,400in public corporations and independent administrative institutions (Figure2-2-9).
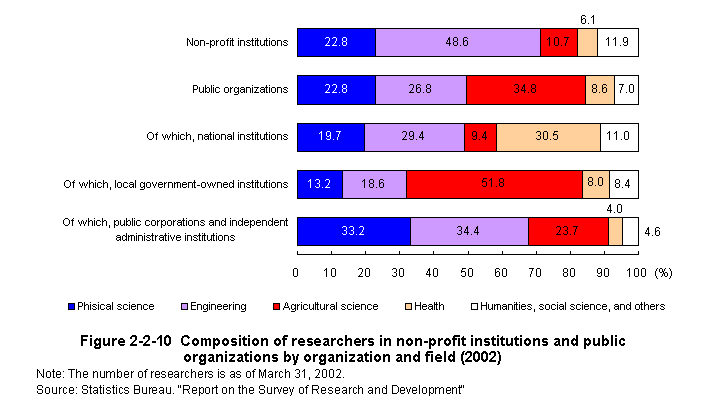
When looking at sector composition,a disproportionately large share of researchers was seen in engineering at non-profit institutions,and among public organizations,in health and engineering at national institutions,in agricultural sciences at local government-owned institutions,and in engineering and the physical sciences at public corporations and independent administrative institutions (Figure2-2-10).
| 2.2.1.3.3 Universities and Colleges |
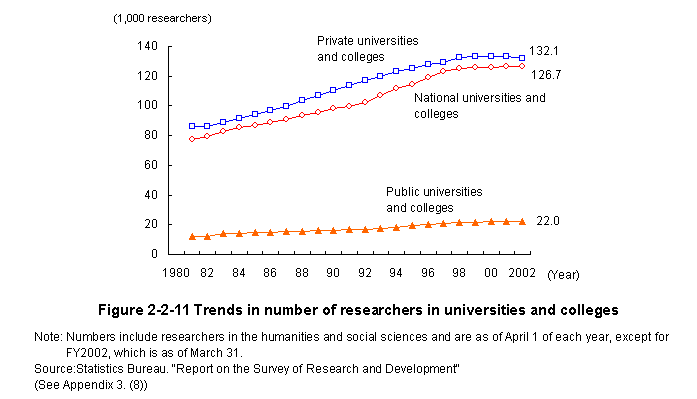
The number of researchers at universities and colleges,including those in the humanities and social sciences,has increased by2.7%in the last five years(1997-2002,an average annual rate of increase of0.54%)up to281,000researchers from273,000.Looking at the number of researchers by type of institution in2002,private universities and colleges have132,000researchers,the largest portion of the total researchers at universities and colleges,followed by national universities and colleges(127,000),after which comes local public universities and colleges(22,000) (Figure2-2-11). However,in terms of researchers whose primary role is research,the order becomes national universities(121,000),followed by private universities(119,000),and then local public universities(18,000).
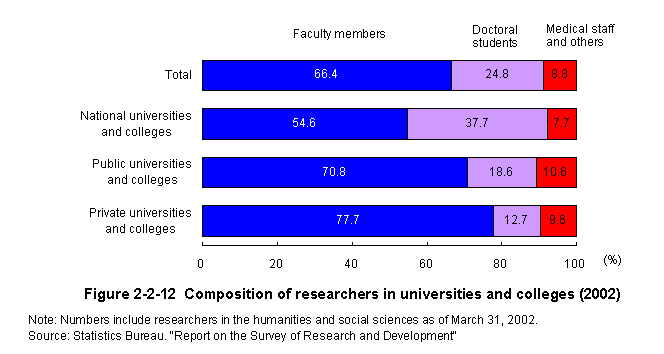
Researchers in universities and colleges consist of teachers,students for doctoral degree,medical staff and others.Looking at the composition of researchers by type of institution,in national universities and colleges,students for doctoral degrees make up a large ratio of the researchers,and private universities and colleges have a greater ratio of teachers and medical staffs and a smaller ratio of students for doctoral degrees.The figures for public universities and colleges fall in between those for the national universities and the private universities and colleges (Figure2-2-12).
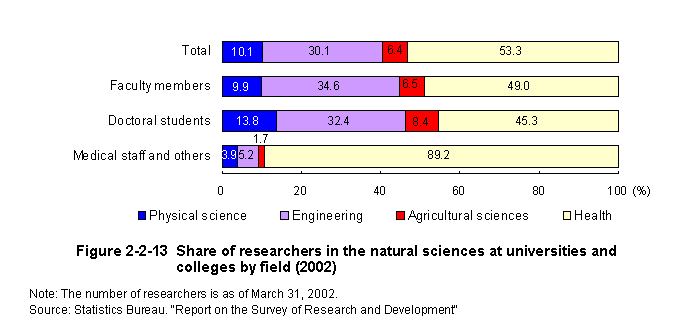
By sector composition,a large share of university researchers were health specialists,whether teachers,students in graduate school doctor pro-grams,or medical staff.Other sectors with relatively high shares of the total were engineering,for teachers,and science,for students in doctor programs (Figure2-2-13).
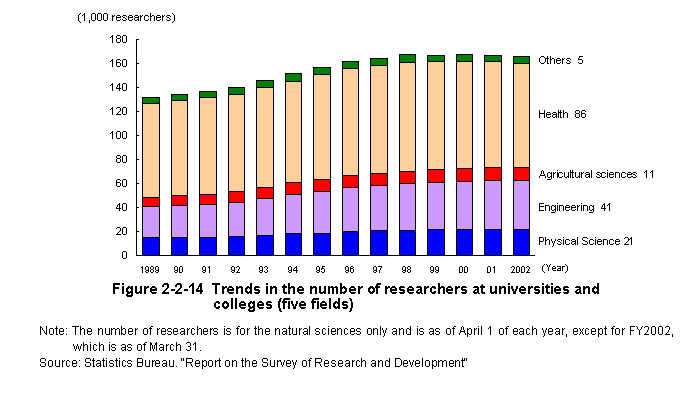
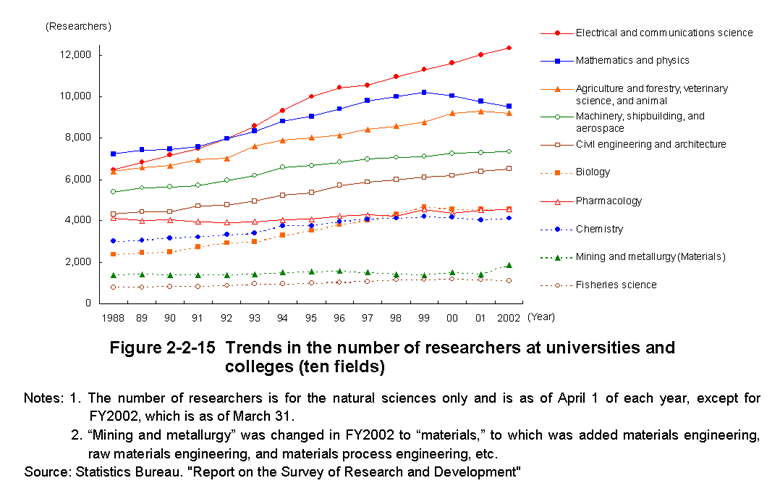
For the number of researchers by academic field in the most recent five-year period(1997-2002),balanced annual growth rates are seen in physical science(at0.68%),engineering(at2.02%),and agricultural sciences(at0.84%),while the health sciences registered a decline of an average annual rate of0.79% (Figure2-2-14) .Looking at specific sectors,the electrical and communications sectors(average annual growth rate of3.17%)and biology(average annual growth rate of2.33%)are showing particularly fast increases in the number of researchers (Figure2-2-15).
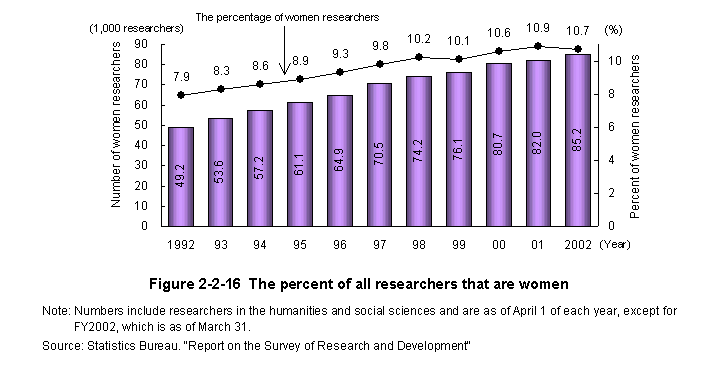
| 2.2.1.3.4 Women Researchers |
Women researchers,including those in the humanities and social sciences,have steadily in-creased year by year,to reach85,000in2002,representing about10.7%of the total number of researchers (Figure2-2-16). But looking at all workers,26.18million women employees accounted for41.0%of the total of63.89million employees in Japan in2001,according to the"Labor Survey of the Ministry of Public Management,Home Affairs,Posts and Telecommunications."It is clear that the ratio of women engaged in the R&D field remains lower than that of women in the labor market in general.The proportion of women researchers by type of organization was5.5%at companies,etc.,8.8%at non-profit institutions,11.3%at public organizations,and19.4%at universities and colleges,clearly demonstrating that universities and colleges provide women researchers more opportunities than elsewhere.
| Back to Top | MEXT HOME |
)
)
)
)
)
)
)
)
)
)
)
)