| Home > Policy > White Paper, Notice, Announcement > White Paper > WHITE PAPER ON SCIENCE AND TECHNOLOGY2003 > Part1 1.2 1.2.1 1.2.1.1 | ||
| (Current State in Japan) |
Let us take a look at the current state of HRST in Japan.
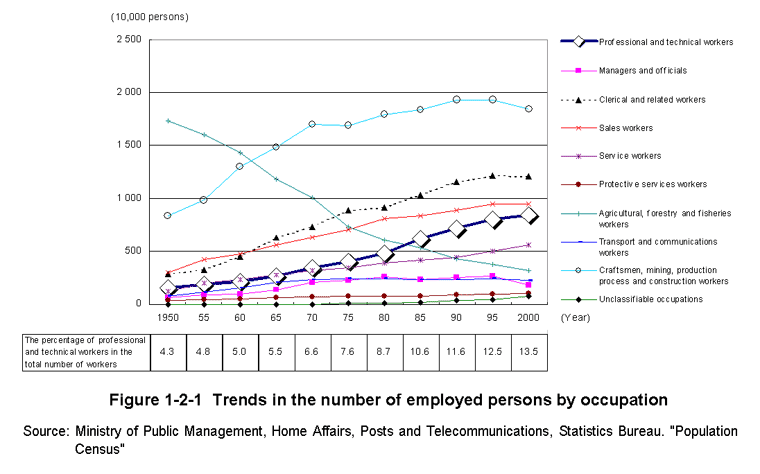
To start with,looking at the number of employed persons by occupational classification in the Population Census,the majority of HRST such as researchers and technicians are classified as"professional and technical workers."It is apparent that their number has been increasing consistently,and their percentage in the total number of employed persons is also increaseing (Figure1-2-1) .
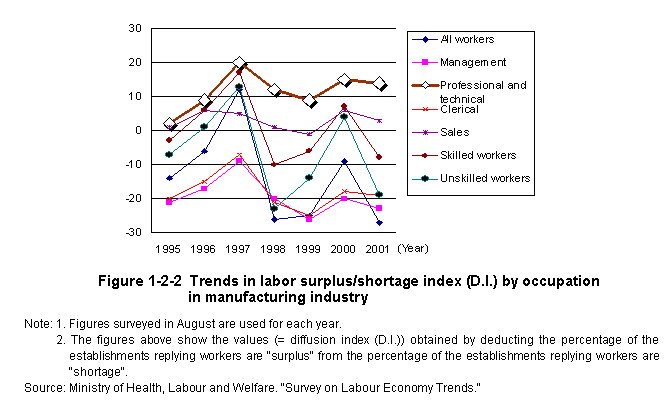
In spite of the fact that the number of HRST has been increasing,as shown above,trends in feelings about labor over-supply/shortage of manufacturing industry by job category indicate that there is a high demand for science and technology personnel.According to the"Survey on Labor Economy Trends"by the Ministry of Health,Labour and Welfare,feelings of labor shortage remain at a high level for"professional and technical"positions occupied by HRST,which have been little affected by changes in the business climate.This comes amidst replies that there is an over-supply of workers across the board in many job categories,reflecting the recent state of the economy (Figure1-2-2) .
Next,let us take a closer look at the stock and flow of HRST in Japan,and also make some comparisons with foreign countries,focusing on the United States.
| (Stock of HRST) |
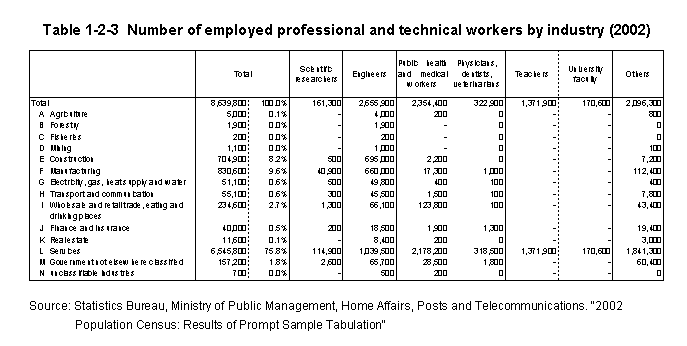
Looking at the breakdown of professional and technical workers by occupation in the Population Census,technicians(about2.66million)account for the largest proportion,followed by workers engaged in the health and medical profession such as doctors(about2.35million),and teachers(about1.37million,of which teachers at universities are about170,000).Also,scientific researchers 2) total about160,000.Looking at the number of pro-fessional and technical workers by industry,the service industry-such as education and health and medical services-accounts for the largest share in any occupation,taking up nearly three-fourths of the total (Figure1-2-3) .
Note2)The discrepancy between the number(161,300)of scientific researchers in the"Population Census"and the number(756,336as of FY2001)of researchers in the"Survey of Research and Development,"which has historically been used in preparing this white paper,is due to the following differences in definitions:
Science researchers in the Population Census:"Those who engage in professional,scientific work such as basic,theoretical research,tests,examinations,analyses,appraisals,or investigations related to the natural sciences,humanities,or social sciences at research facilities including research institutes,experimental laboratories,and research departments.However,those who engage in research at university research departments while conducting lectures are classified as teachers."This definition makes the classification not around the act of performing research,but around the location where the research is engaged in.
Researchers in the Survey of Research and Development:"Those who possess university level(excluding junior college)or equivalent or higher specialist knowledge and who conduct research on specified themes at business enterprises,research institutions,or universities and colleges,etc."This definition makes the classification in relation not to the location(i.e.institution),but to the engagement in research.Hence,some"engineers"and"teachers"(especially university faculty)from the Population Census are considered to be included in this category.
| (Stock of Researchers) |
Looking within science and technology personnel specifically at researchers-who are the fountainhead of knowledge creation-Japan ranks among the highest level in the world from a quantitative point of view.The Ministry of Public Management,Home Affairs,Posts and Telecommunications'"Survey of Research and Development"indicates that Japan ranks second after the United States among major countries in terms of the number of researchers and first in terms of the number of researchers per10,000population and per10,000labor force workers (Table1-2-4) .
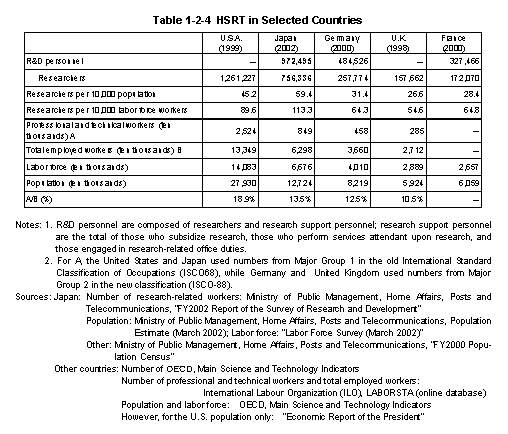
Comparing the stock of science and technology personnel in major countries,the number of persons engaged in work related to research in Japan is,similar to researchers,the highest in the world per10,000population and per10,000labor force workers.While this is substantial quantitatively,the ratio of"professional and technical workers,"which includes researchers,over the total number of employed persons is dropping compared to the United States,which uses the same international occupational classifications.
| (Flow of HRST) |
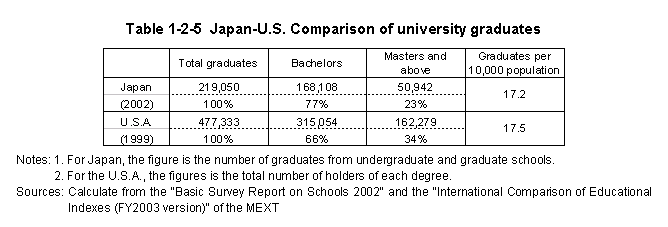
Looking at the number of graduates from universities(of natural science)-institutions that train science and technology personnel,specifically researchers and technicians who have advanced knowledge and skills-the number of new graduates from undergraduate programs and graduate schools in Japan in March2002was about220,000,about half of that in the United States,although the number of new graduates per10,000population is almost the same as that in the United States.In Japan,however,the proportion of holders of a master's degree or higher is lower that that in the United States,indicating that educational attainment is higher in the United States (Table1-2-5)
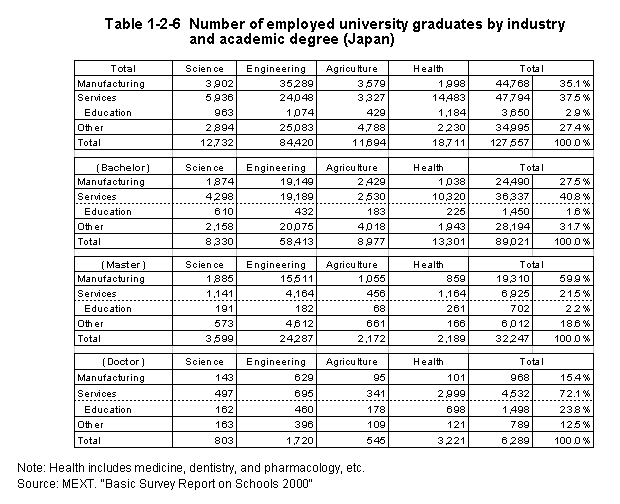
As for the employment by industry of new graduates from universities and graduate schools of natural sciences in Japan,the leading employer of new graduates with a bachelor's degree has shifted in recent years from the manufacturing industry to the service industry,while graduates with a master's degree,primarily those from engineering courses,have still found positions mostly in the manufacturing industry,and graduates from doctoral courses have found positions more in the service industry(education,particularly as teachers at universities) (Table1-2-6) .
Additionally,it is possible to make rough comparison between Japan and the United States in terms of the number of employed persons by occupation.Looking at the proportion of researchers,technicians,and university teachers among professional and technical workers in Japan as compared to the proportion of scientists and technicians in the United States,Japan has a higher proportion of bachelor's and master's degree holders working as researchers and technicians.In the United States,bachelor's degree holders in particular are widely employed in occupations that are not directly related to science and technology such as management,sales,and marketing.On the other hand,there is a reversal in the proportion of researchers and technicians at the doctoral level,with the United States having the higher proportion (Table1-2-7) .
| Back to Top | MEXT HOME |