| Home > Policy > White Paper, Notice, Announcement > White Paper > EDUCATIONAL STANDARDS IN JAPAN 1975 > CHAPTER1 3 (2) a | ||
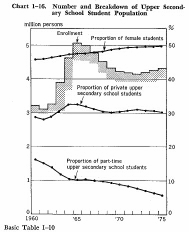
Enrollment in upper secondary schools stood at 4,330,000 persons as of 1975.
Viewing transition after 1960, it rose steadily from a low of 3,120,000 in 1961 to a peak of 5,070,000 in 1965, but gradually declined in subsequent years to 4,150,000 in 1972, then turned toward a gradual increase after 1973. The proportion of enrollment in part-time courses declined year by year after 1960 to 5.6% (240,000 persons) in 1975.
In addition, enrollment in correspondence courses, which had been growing yearly untill 1972, stood at 150,000 as of 1975.
The proportion of enrollment in private upper secondary schools had changed in parallel with the transition in enrollment in all upper secondary schools across the nation till around 1969, but has not shown any particular change in subsequent years, remaining at 30-32%. While the enrollment in all upper secondary schools has been on a gradual increase, the proportion of enrollment in private upper secondary schools has been exhibiting a downward trend.
The proportion of female students has been growing year by year in parallel with the rise in the rate of female lower secondary school pupils going on to upper secondary schools, reaching 49.7% in 1975.
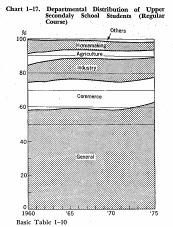
Out of all upper secondary school students in Japan in 1975, those enrolled in general courses accounted for 63.0%, those in commercial courses 14.5%, those in technical courses 11.8%, those in agricultural courses 4.5%, those in homemaking courses 4.5% and those in other courses 1.7%. The proportion of students enrolled in regular courses rose to 63% in 1975, or up 5% from 58% in 1960. On the other hand, enrollment in specialized courses fell 5% as a whole during the same period, with particularly marked decline shown in the enrollment in the homemaking and agricultural courses, enrollment in technical courses also taking a gradual downturn from the peak years of 1970 and 1971.


| Back to Top | MEXT HOME |