| Home > Policy > White Paper, Notice, Announcement > White Paper > WHITE PAPER ON SCIENCE AND TECHNOLOGY2003 > Part2 2.1 2.1.3 | ||
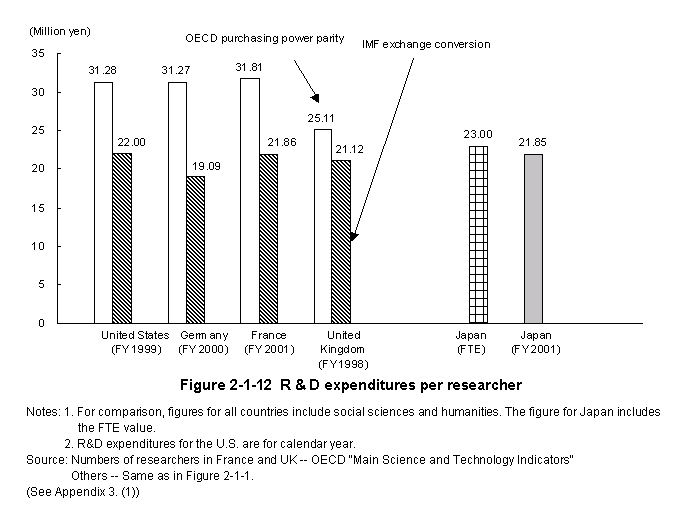
Because of differences in how researchers are targeted,in survey methods used,and in exchange rates,simple comparisons between countries of R&D expenditures per researcher may not be precise.Nevertheless,a look at statistics for five major countries shows Japan ranked third when the yen is converted to the IMF exchange rate,and ranked last when the OECD's purchasing power parity conversion rate is used (Figure2-1-12) .

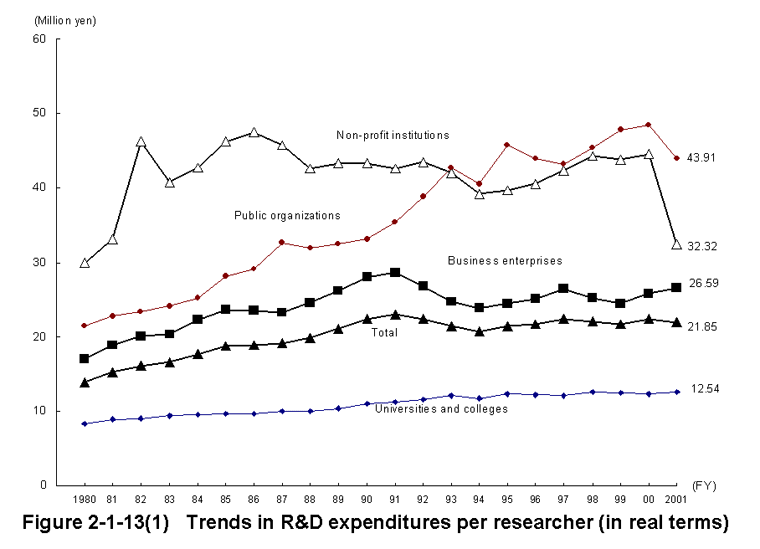
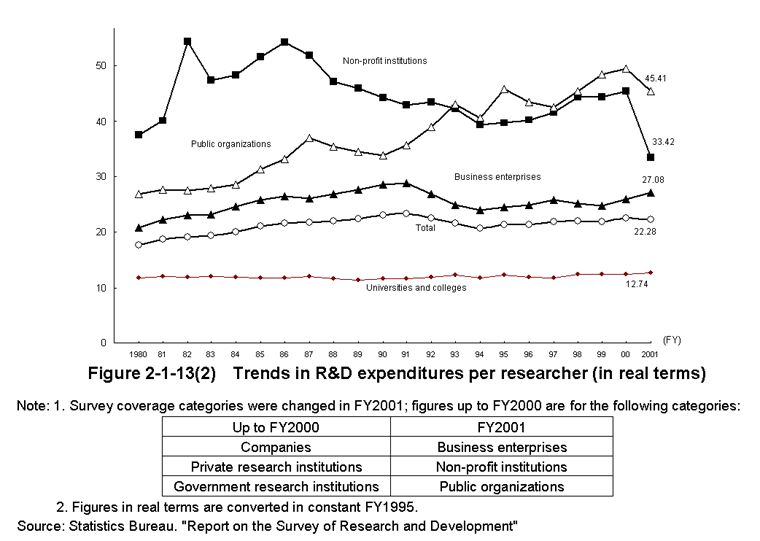
Japan's R&D expenditures per researcher have been hovering around22million yen in recent years.
For R&D expenditures per researcher by type of organization in FY2001,public organizations and non-profit institutions with high ratios of non-personnel R&D expenditures also registered high R&D expenditures per researcher,while universities and colleges,where the ratio of non-personnel R&D expenditure was low,registered lower expenditures per researcher (Figure2-1-13) .


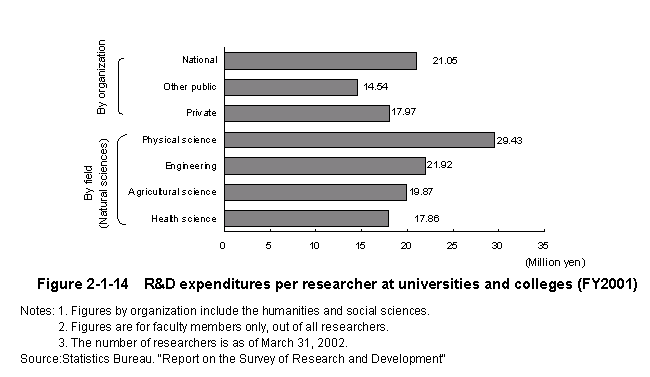
If we limit the R&D expenditures per researcher at universities and colleges,to that invested in those teachers,then the national universities with particularly high non-personnel R&D expenditure have the highest expenditures per researcher,fol-lowed by private universities and other public uni-versities.By specialty(academic field),the rank-ings were,in order,physical science,engineering,agricultural sciences,and health sciences (Figure2-1-14) .

| Back to Top | MEXT HOME |