| Home > Policy > White Paper, Notice, Announcement > White Paper > EDUCATIONAL STANDARDS IN JAPAN 1975 > CHAPTER6 1 (3) | ||
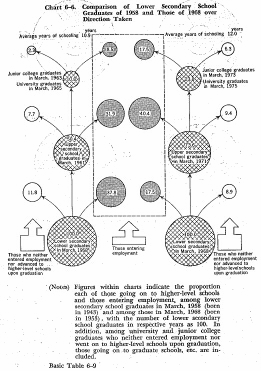
Chart 6-6 is intended to give a general idea on direction taken by lower secondary school graduates of a certain year before finally enteringemployment.
A quantitative view of those entering employment shows that among lower secondary school graduates in March, 1958, the proportion of those entering employment after graduation from lower secondary schools was the highest at 37.8%, whereas, among lower secondary school graduates in March, 1968, the proportion of those entering employment after graduation from upper secondary schoo1s was the latgest at 40.4%.

Viewing quantitatively advancement to higher-level schools, it is found that out of lower secondary school graduates in March, 1958, 50% completed upper secondary education and l1% university (undergraduate courses) or junior college education, whereas in 1968 these figures were 74% and 24%, respectively.
Consequently, the average years of schooling of lower secondary school graduates in March, 1968 were calculated at 12.0 years, about one year longer than the 10.9 years which was ca1cu1ated for lower secondary school graduates in March, 1958.
| Back to Top | MEXT HOME |