| Home > Policy > White Paper, Notice, Announcement > White Paper > EDUCATIONAL STANDARDS IN JAPAN 1975 > CHAPTER4 1 (1) | ||
As of 1975, there were 24,652 elementary schools (including main schools and their branch schools), of which 71 were national, 24,421 were local and 160 were private. Since there were 25,977 elementary schools in 1965, the number of elementary schools is found to have declined by 1,325 during the last decade.
As of 1975, there were 10,751 lower secondary schools, of which 76 were national, 10,120 were local and 555 were private. Since there were 11,040 lower secondary schols in 1970, the number of lower secondary schools is found to have dwindled by 289 during the last five years.
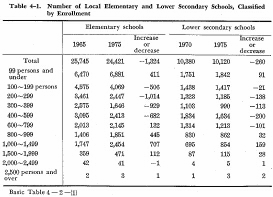
Next, distribution of the number of local elementary schools in 1965 and 1975 and that of local lower secondary schools in 1970 and 1975 - as classified by the size of schools in terms of enrollment-are shown in Table 4-1.

For elementary schools, sharp decline is shown in the number of schools with 100-599 persons, while considerable growth has been shown in the number of both small-sized schools with 99 persons and under and relatively large schools each with 600 persons and over.
As for lower secondary schools, the number of schools with 100-799 persons have decreased while both those with 99 persons and under and those with 800 pdrsons and over have increased.
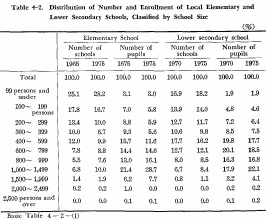
Distribution of the number of local elementary and lower secondary schools, classified by the size of schools, is shown in Table 4-2 in contrast to that of enrollment.
For elementary schools, the proportion of small-sized schools, witlt 99 persons and under, to the total number of schools rose from 25% in 1965 to 28% in 1975, but thete has been'little change during the last decade in the proportion of pupils enrolled in those schools, which stayed only at 3%. On the other hand, the proportion of relatively large-sized schools, with 600 persons and over, climbed from 22% in 1965 to 29% in 1975, and that of pupils enrolled in those schools also rose from 56% in 1965 to 68% in 1975, surpassing the proportion of the number of those schools. As for the schools with 100-599 pupils, a considerable decline has been shown both in the proportion of the number and that of pupils enrolled.
As for lower secondary schools, the proportion of schools with 200-799 persons fell from 54% in 1970 to 50% in 1975 in terms of the number of schools and from 56% to 50% in terms of enrollment. The proportion of relatively large-sized schools with 800 persons and over rose from 16% in 1970 to 18% in 1975 in terms of the number of schools and from 38% to43% in terms of enrollment. In case of schools with less than 200 persons, the proportion of their number grew, but little change has been observed in the proportion of enrollment.

| Back to Top | MEXT HOME |