| Home > Policy > White Paper, Notice, Announcement > White Paper > EDUCATIONAL STANDARDS IN JAPAN 1975 > CHAPTER3 1 (1) | ||
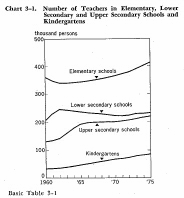
As of 1975, there were a total of 959,000 full-time teachers, including415,000 in elementary schools, 235,000 in lower secondary schools, 223,000in upper secondary schools, and 86,000 in kindergartens. Their totalnumber has increased by 230,000 over the last 15 years.
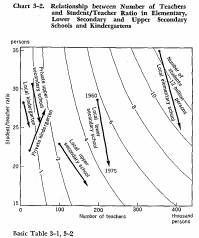
Transition in the number of students per full-time teacher during1960-75 in relation to transition in the number of students and teachersis shown in Chart 3 -2. It indicates that the pupil/teacher ratio dwindledmarkedly from 35.0 persons to 25.0 in local elementary schools and from28.6 to 20.2 in local lower secondary schools.
At the upper secondary school level, the student/teacher ratio droppedfrom 22.9 'persons to 17.6 persons in local upper secondary schools andfrom 30.6 to 25.7 in private upper secondary schools. At the kindergartenlevel, the number of children enrolled per teacher fell from 28.3 to 25.2in local kindergartens, but gained from 22.0 to 27.3 in private kindergartens.
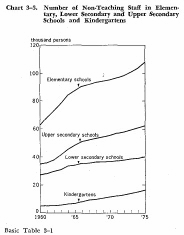
As shown in Chart 3-3, the number of full-time non-teaching staffhas been increasing year by year, in 1975 reaching 108,000 persons inelementary schools, 40,000 in lower secondary schools, 62,000 in upper secondary schools and 16,000 in kindergartens.
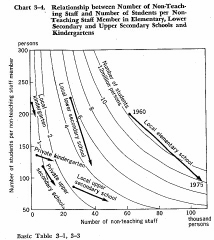
The number of students per non-teaching staff has been on gradualclecline at each school level, suggesting some improvement in the distribution of non-teaching staff in schools.
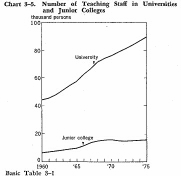
The number of full-time teaching staff (those above the level of assistant,including full-time teachers of attached reseachers institutes, stc.) of universities and junior colleges, with yearly growth, reached 90,000 inuniversities and 16,000 in junior colleges as of 1975, showing an increaseof 45,000 in universities and 10,000 in junior colleges over the last 15 years.
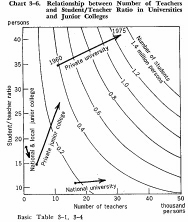
The number of students (in undergraduate courses at universitiesand regular courses at junior colleges) per full-time teaching staff memberat the level of lecturer in 1960 and in 1975 are compared in Chart 3-6.It shows an increase in every type of school, except in national andlocal junior colleges. Particulary noteworthy is the growth in the numberof students per full-time teaching staff in private universities andjunior colleges. In addition, in order to make a precise year-to-yearcomparison and one of schools classified by establishing body, the rangein the distribution of students by respective fields of specialization has to be taken into consideration.
In view of the large part-time teaching staff found in universitiesand junior colleges, the number of students per teaching staff member has been calculated after adding the total number of part-time teaching staff converted into the number of full-time teaching staff, to the total number of full-time teaching staff (Cf. Chart 3-18, for method of conversion),and is shown in the following table. It is found that, even with addition of the number of part-time teaching staff converted into full-time teachingstaff, the number of students per teaching staff member in 1975 exceeded the level of 1960 at private universities and juniori colleges.

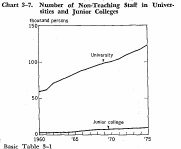
The number of full-time non-teaching staff in universities and junior colleges, with yearly growth, totaled 123,000 and 10,000' respectively asof 1975.
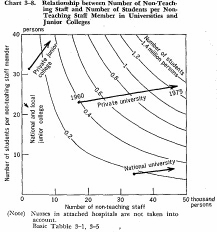
The number of students per full-time non-teaching staff member isshown in Chart 3-8.
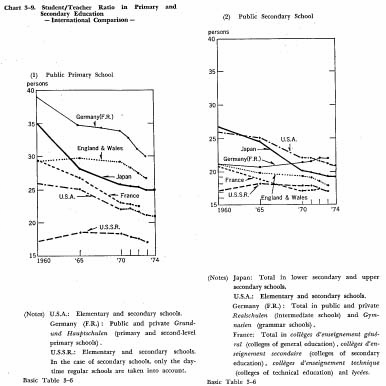
Comparing the student/teacher ratio in several selected countries, itis seen that the number of pupils per elementary school teacher has beenin a declining trend in every country in recent years. The pupil/teacherratio for Japan in recent years has been stayed below that in Englandand Waies and the Federal Republic of Germany.
The number of students per secondary school teacher, found to differless than that of pupils per elementary school teachers, has been takinga downward turn since the second half of the l960s in every country exceptthe Federal Republic of Germany. Since 1970, the number of studentsper secondary school teacher in Japan has been stayed below that in theUnited States and the Federal Republic of Germany.
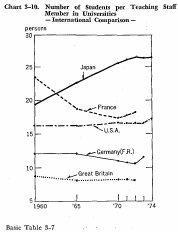
Strict international comparison of the number of students peruniversity teacher in each country is difficult because it is hard to equalize the sphere of activity of university teachers who are actually teaching, but a rough comparison is shown in Chart 3-10.
This chart indicates a noticeable trend toward increase in every country except in Great Britain in recent years.
| Back to Top | MEXT HOME |