| Home > Policy > White Paper, Notice, Announcement > White Paper > EDUCATIONAL STANDARDS IN JAPAN 1975 > CHAPTER1 4 (3) e | ||
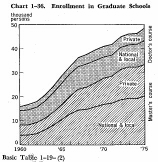
Turning to enrollment in graduate schools, there were a total of 34,000 students enrolled in the master's course and 15,000 enrolled in the doctor's course, as of 1975. As compared with the 1965 level, the enrollment in the master's course was twice as large and that in the doctor's course was 30% larger. Classified by the type of graduate institution, as of 1975, the proportion of enrollment in national graduate schools stood at 56.l% at the level of master's course as against 4.0% in local graduate schools and 39.9% in private graduate schools, while the proportion of enrollment in national graduate schools accounted for 59.7% at the level of doctor's course as against 6.5% in local graduate schools and 33.8% in private graduate schools. In both the master's course and doctor's course, the proportion of enrollment in private graduate schools has been showing a sharp increase since the second half of the l960s.

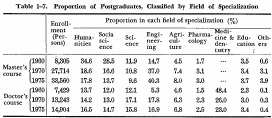
Looking at the proportion of postgraduates in 1975, classified by the field of specialization, those specializing in engineering ranked the highest in the master's course, followed by those in humanities, social science and science in that order, whereas those specializing in the medical and dental fields ranked the highest in the doctor's course, followed by those in engineering, humanities, science and social science in that order. As for transition in the proportion of postgraduates in each field of specialization, it should be noted that the proportion of those in the engineering field has been on the increase in the master's course as against the gradual decline in the proportion of those in the fields of humanities and social science, while the proportion of those in the medical and dental fields has been on a sharp decline in the doctor's course.

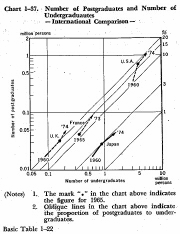
The relationship of the number of postgraduates to that of undergraduates in several selected countries is shown in Chart 1-37. The number of postgraduates in the U.S. is preeminently large, while in Japan it is about the same as that of the United Kingdom. For France, the enrollment in the troisieme cycle (third course) of universities (research courses after finishing the four-year undergraduate courses) is taken as an object of comparison. It is larger than that of Japan or the United Kingdom.
And, as indicated by the oblique lines in Chart 1-37, the number of postgraduates stands at over 10% of the number of undergraduates in the countries other than Japan, with this rate growing year by year.
In Japan, little change has been discerned in the growth rate since 1960, which remains at around 3%.

| Back to Top | MEXT HOME |