PREVIOUS NEXT
APPENDICES
A. Basic Tables
Chapter 3 Supply of Teachers and Improvemenat of Educational Conditions
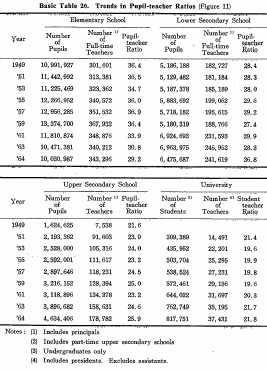
Basic Table 20. Trends in Pupil-teacher Ratios (Figure
11)
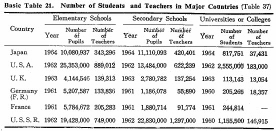
Basic Table 21. Number of Students and Teachers in Major
Countries (Table 37)
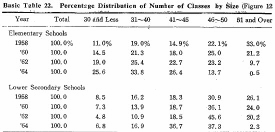
Basic Table 22. Percentage Distribution of Number of Classes
by Size(Figure 12)
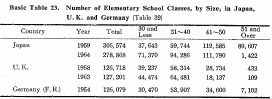
Basic Table 23. Number of Elementary School Classes, by
Size, in Japan, U. K. and Germany (Table 39)
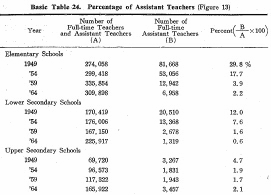
Basic Table 24. Percentage of Assistant Teachers (Figure
13)
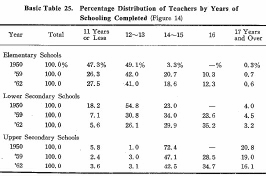
Basic Table 25. Percentage Distribution of Teachers by
Years of Schooling Completed (Figure 14)
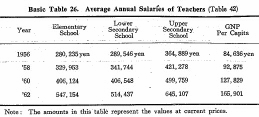
Basic Table 26. Average Annual Salaries of Teachers (Table
42)
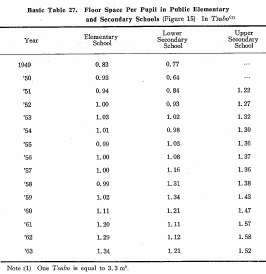
Basic Table 27. Floor Space Per Pupil in Public Elementary
and Secondary Schools (Figure 15) in Tsubo
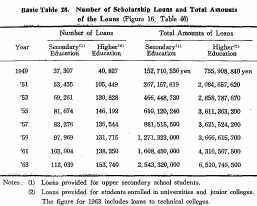
Basic Table 28. Number of Scholarship Loans and Total Amounts
of the Loans (Figure 16, Table 46)
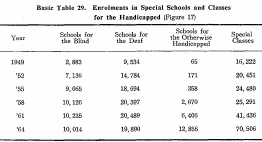
Basic Table 29. Enrolments in Special Schools and Classes
for the Handicapped (Figure 17)
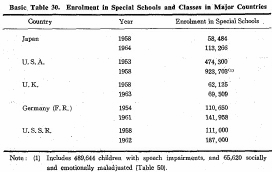
Basic Table 30. Enrolment in Special Schools and Classes
in Major Countries
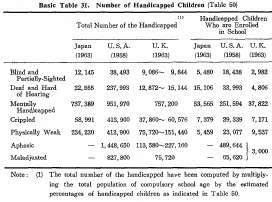
Basic Table 31. Number of Handicapped Children (Tattle
50)
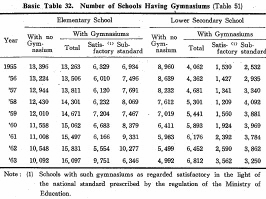
Basic Table 32. Number of Schools Having Gymnasiums (Table
51)
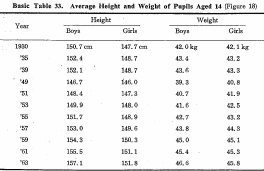
Basic Table 33. Average Height and Weight of Pupils Aged
14 (Figure 18)
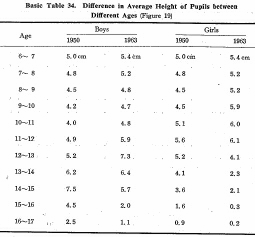
Basic Table 34. Difference in Average Height of Pupils
between Different Ages (Figure 19)
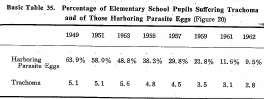
Basic Table 35. Percentage of Elementary School Pupils
Suffering Trachoma and of Those Harboring Parasite Eggs (Figure 20)
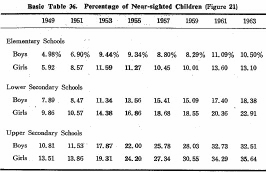
Basic Table 36. Percentage of Near-sighted Children (Figure
21)
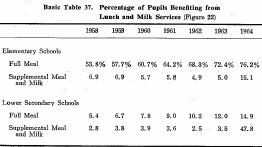
Basic Table 37. Percentage of Pupils Benefiting from Lunch
and Milk Services (Figure
PREVIOUS NEXT
(C)COPYRIGHT Ministry of Education, Culture, Sports, Science and Technology