| Home > Policy > White Paper, Notice, Announcement > White Paper > EDUCATIONAL STANDARDS IN JAPAN 1965 > CHAPTER1 5 | ||
By the democratization of education after World War ![]() and increased
percentage of applicants for higher education according to the rise in the living
level of the people, the educational level of the Japanese people has been greatly
elevated. Let us look into the educational level of the people in 1935, 1950
and 1960, by the percentage distribution of the productive-age population by
educational attainments. The percentages of those who completed secondary education
and higher education increased to a great extent. On the other hand, the percentages
of the people who did not attend schools and who completed elementary education
only decreased almost to the vanishing point.
and increased
percentage of applicants for higher education according to the rise in the living
level of the people, the educational level of the Japanese people has been greatly
elevated. Let us look into the educational level of the people in 1935, 1950
and 1960, by the percentage distribution of the productive-age population by
educational attainments. The percentages of those who completed secondary education
and higher education increased to a great extent. On the other hand, the percentages
of the people who did not attend schools and who completed elementary education
only decreased almost to the vanishing point.

This elevation of the educational level of the productive-age population the result of such factors as the democratization of the social system, the progress of science and technology, the development of secondary and tertiary industries and the rise in the standard of living.
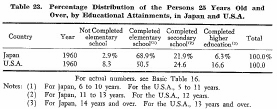
As mentioned above, the educational standard of the people has risen gradually. In comparison with the level of education in the U.S.A. showing the great expansion of education, the percentage of those who received higher education was considerably low and the percentage of those who had not completed elementary education was a little high.

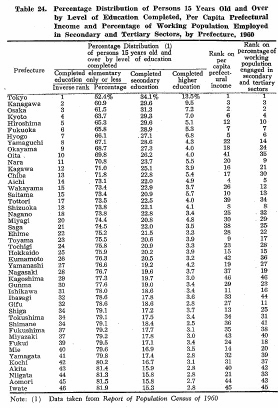
In considering the percentage distribution of persons 15 years old and over by level of education completed, using figures taken from Report of Population Census of 1960, the disparities among prefectures were very large. The percentage completing only elementary or less education range between the high of 81.9 per cent in Iwate and the low of 53.4 per cent in Tokyo. The disparity in the percentage of those who received higher education was seen between the high of 13.5 per cent in Tokyo and the low of 2.5 per cent in Shimane.
Table 24 presents data showing a high positive relationship between average educational level, per capita prefectural income, and percentage of employed population engaged in secondary and tertiary sectors among the prefectures of Japan in 1960.

| Back to Top | MEXT HOME |