| Home > Policy > White Paper, Notice, Announcement > White Paper > Japanese Government Policies in Education, Culture, Sports, Science and Technology 2002 >Chapter2 Section2.2 | ||
At the National Institute for Educational Policy Research (referred to as "the Institute" hereafter) Curriculum Research Center, the Research on Curriculum for Primary and Lower Secondary Schools in FY 2001 was carried out as follows.
The purpose of this research is to examine the implementation status of the Curriculum based on the Courses of Study for Primary and Lower Secondary Schools (notification in 1989) through understanding how study is conducted in the light of the targets and contents of each subject in the Courses of Study, and to contribute to improvement in guidance at school in the future by clarifying problems in guidance, etc.
The Research on Curriculum has been conducted twice by the Ministry of Education, from FY 1981 to FY 1983 and from FY 1993 to FY 1995.
| 1) Details of Research |
From the contents set in the Courses of Study, items suitable for paper tests are surveyed.
Additionally, in order to bring out attitudes of children towards study, the realities of guidance by teachers, etc., children and teachers are surveyed by questionnaire.
| 2) Surveyed grades, subjects, etc. |
| Primary school 5th and 6th graders : |
Japanese, social studies, arithmetic, science (approximately 3,500 schools and 208,000 children)
| Lower secondary school 1st-, 2nd- and 3rd-year students : |
Japanese, social studies, mathematics, science, English (approximately 2,500 schools and 243,000 children)
| 1) Results of paper tests |
| (a) Summary for each subject, grade, etc. |
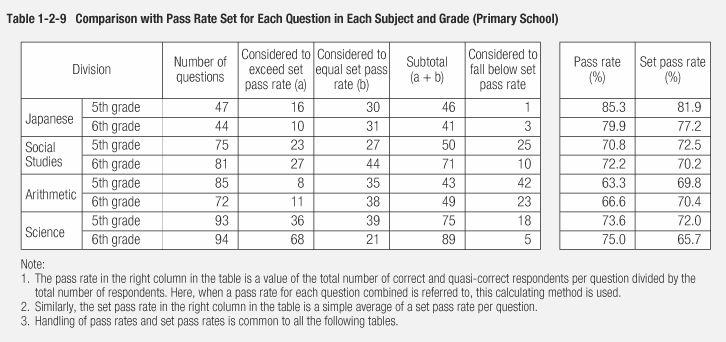
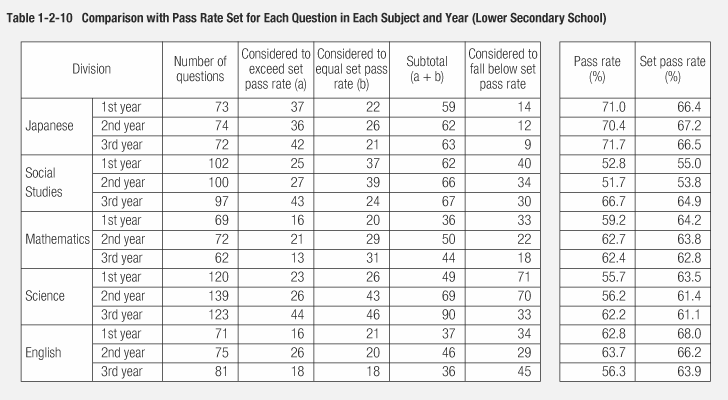
Judging from the conduct of study in the light of targets and contents of each subject in the Courses of Study in comparison with the set pass rate (*) of each question, except for science in lower secondary school 1st and 2nd years, and English in lower secondary school 3rd year, the total number of questions that are considered to exceed or equal the set pass rates are more than half of all the questions, which is, broadly speaking, a good result on the whole ( Tables 1-2-9 and 1-2-10 ).
| *Set Pass Rate |
Set pass rate means a pass rate (rate of correct answers or quasi-correct answers), assuming standard learning activities have been done on the contents of the Courses of Study. A set pass rate is set for each question.
The situations compared with the pass rates for the same questions in the previous survey conducted from FY 1993 to FY 1995 are shown in Tables 1-2-11 and 1-2-12 .
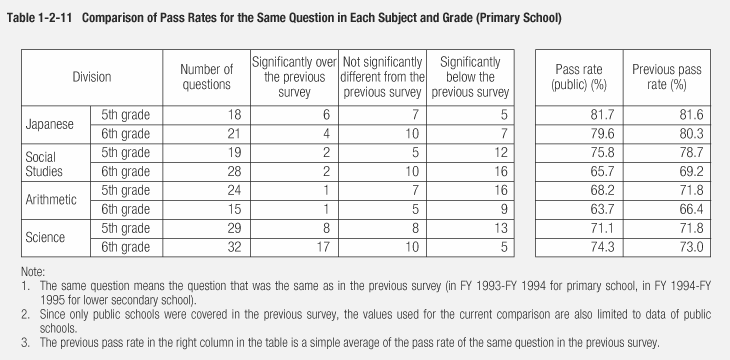
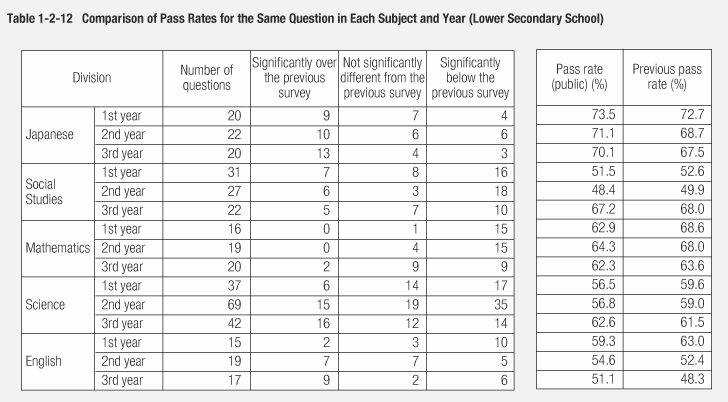
As a result, for science in primary school 6th grade, Japanese in lower secondary school 3rd year, and English in lower secondary school 3rd year, questions that significantly exceeded the previous rates were in the majority, while for social studies and arithmetic in primary school, social studies in lower secondary school 1st and 2nd years, mathematics in lower secondary school 1st and 2nd years, science in lower secondary school 2nd year, and English in lower secondary school 1st year the majority in questions were significantly below previous rates. Ranges of variance, however, were roughly within 3 to 4% in each subject or grade.
| (b) Distribution of numbers of children and distribution of classes according to scores |
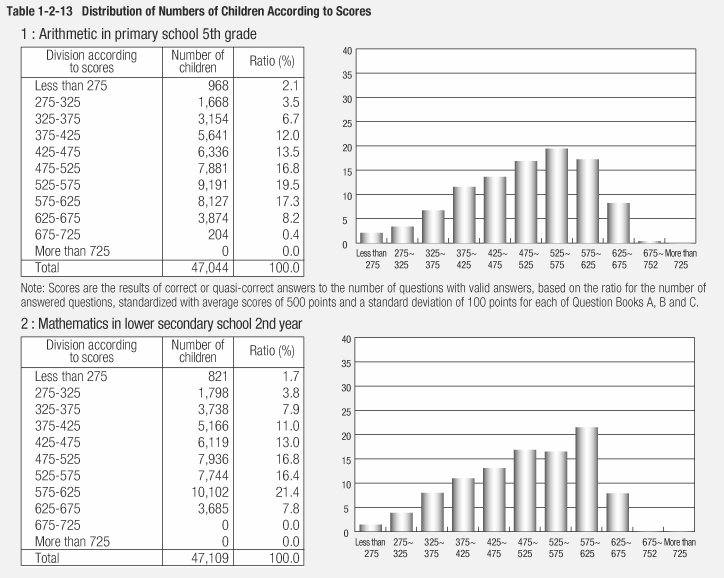
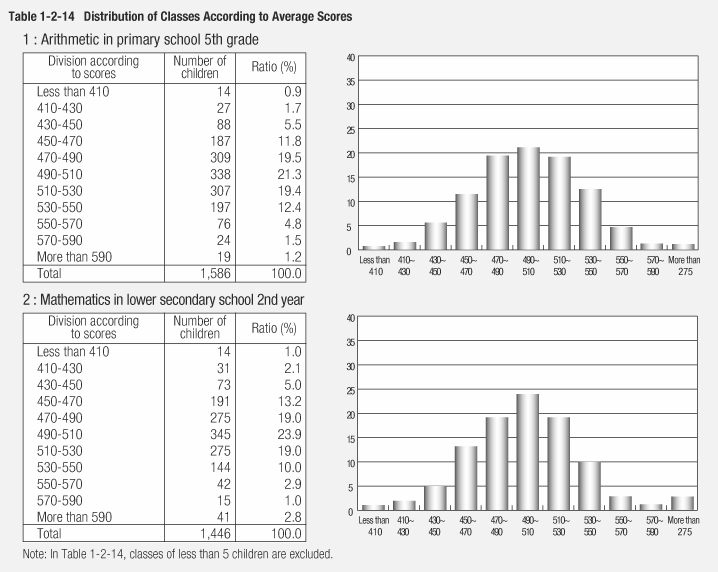
Distribution of numbers of children according to scores is thick in the middle, getting thinner with the increase or decrease of scores; so-called bipolarization of academic ability, in which distribution is relatively thin in the middle, and separated into children with high ability and those with low ability, was not found. From distribution of classes according to average scores, it is observed that there are some classes with generally low scores ( Tables 1-2-13 and 1-2-14 ).
| 2) Results of questionnaire |
| (a) Attitude towards study |
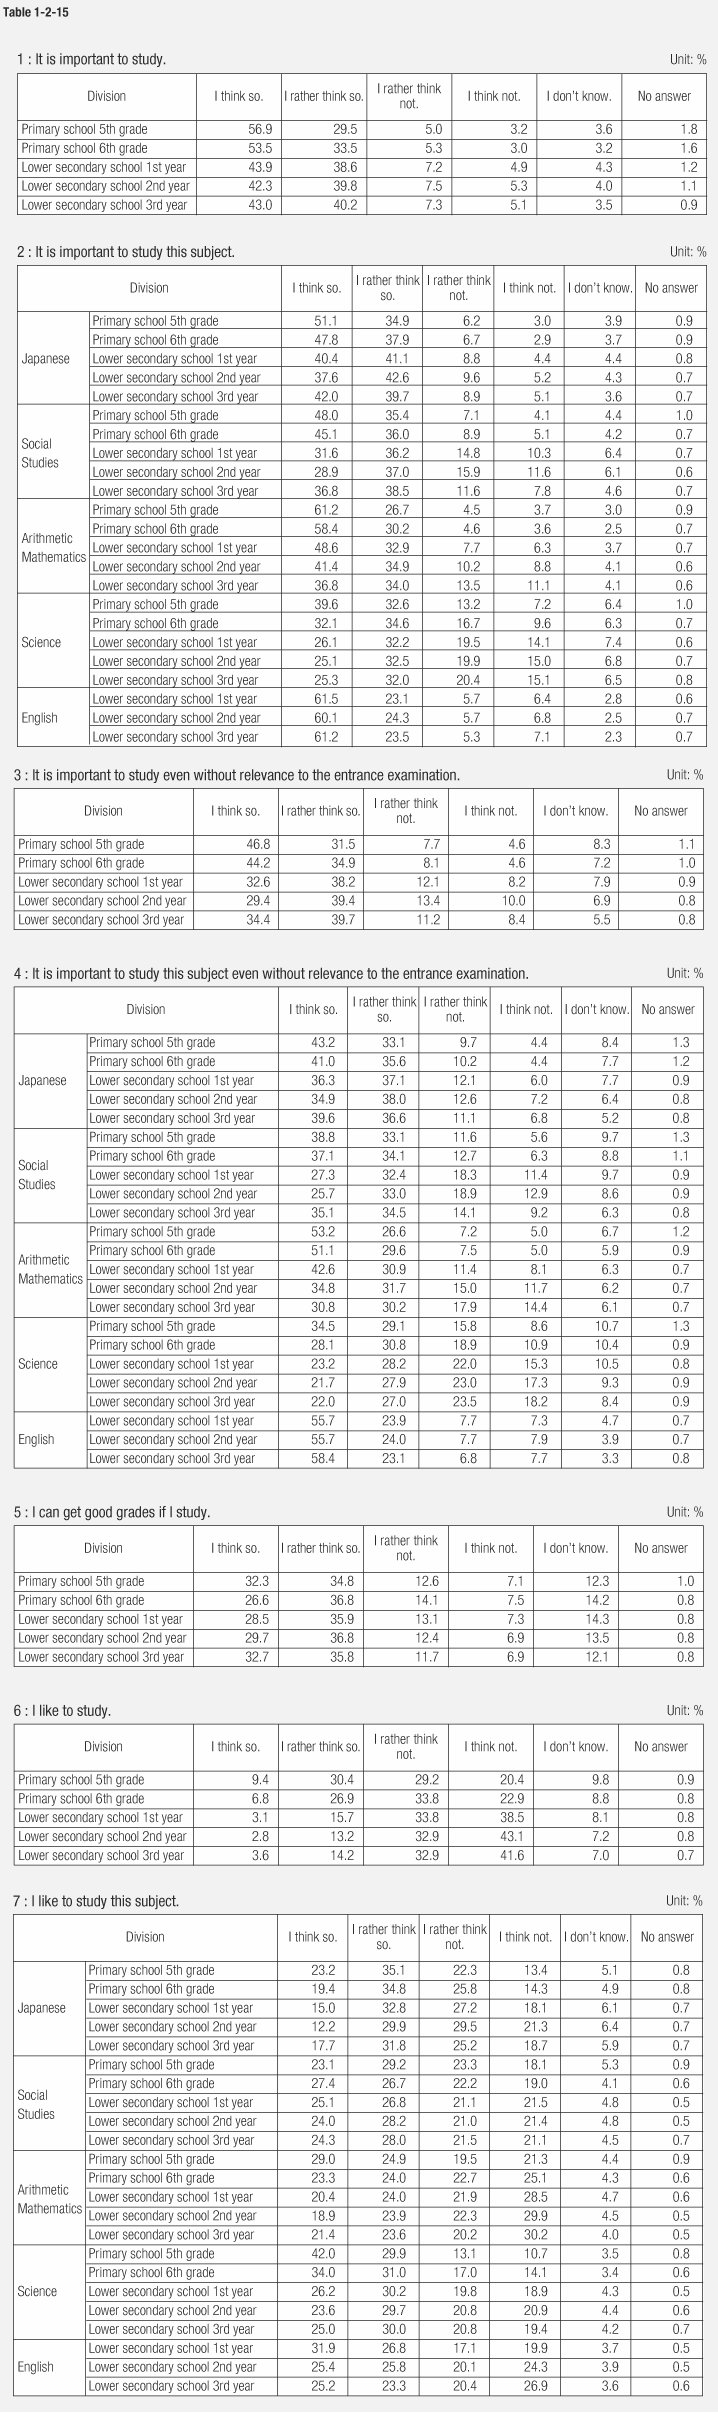
Regarding questions on the importance of study, affirmative answers are the majority. For example, to the statement "It is important to study", the total ratio of children who answered "I think so" and "I rather think so" (both of them together will be called affirmative answers hereafter) was more than 80%; and to the idea "It is important to study even without relevance to the entrance examination", those with affirmative answers were 70 to 80%. Furthermore, to the statement "I can get good grades if I study", over 60% of children gave affirmative answers. As to the statement "I like to study", those who answered "I rather think not" and "I think not" exceeded affirmative answers and the ratio was higher in lower secondary school than in primary school. However, when individual subjects were mentioned, and a question was asked for each subject, ratios of affirmative answers to "I like to study this subject" were higher than when asked simply whether or not they liked to study ( Table 1-2-15 ).
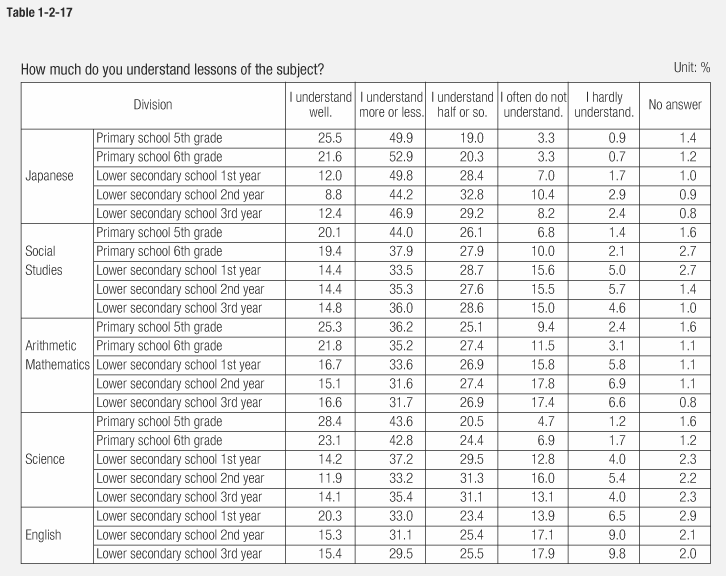
| (b) Understanding of lessons |
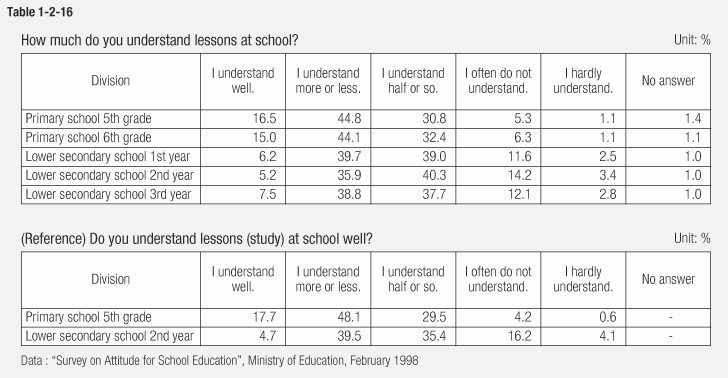
Regarding the question of how much lessons are understood, the total of "I understand well" and "I understand more or less" is about 60% in primary school and 40 to 50% in lower secondary school, a situation similar to the results of the Survey on Attitude for School Education conducted by the Ministry of Education in February 1998. Note that the situation of understanding differs according to subjects ( Tables 1-2-16 and 1-2-17 ).
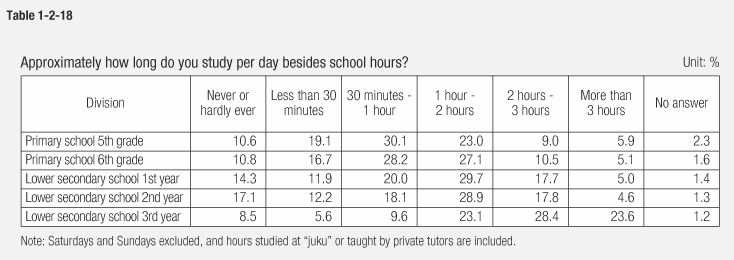
| (c) Time spent studying on weekdays other than school lessons |
In answers to this question, on weekdays, about 70% of primary school 5th and 6th graders study more than 30 minutes besides school lessons; about half of lower secondary school 1st- and 2nd-year students study more than 1 hour; and among 3rd-year students, about half study more than 2 hours, and about a quarter, 23.7% to be precise, study more than 3 hours (students who study "more than 3 hours" are included in "more than 2 hours").
On the other hand, the ratio of students who "never or hardly ever study" is 14.3% and 17.1% for lower secondary school 1st year and 2nd year, respectively, both of which are higher than other years and grades ( Table 1-2-18 ).
| 1) Roundup and evaluation of results |
As already discussed, as far as can be seen in the relationship with the set pass rates, results of this survey have shown that the learning status of children is, roughly speaking, good on the whole in both primary and lower secondary schools, though there are some problems in science in lower secondary school 1st and 2nd years, for example.
As regards rates of correct answers, etc., of the same questions included in both this survey and the previous one (conducted in 1993 - 1995), a case where the majority of rates are significantly higher than the previous survey statistically is regarded as "up"; a case where the majority are significantly lower than the previous survey statistically is regarded as "down"; and other cases are regarded as "no change". Out of 23 grades/years and all subjects, 3 grades/years and subjects are up, no change in 10 grades/years and subjects, and another 10 grades/years and subjects are down. For example, science and arithmetic/mathematics are considered down in all grades/years except for lower secondary school 3rd year; on the whole, however, ratios of variance are roughly within 3 to 4% for both up and down cased, so it can be said that the changes are not big.
On the other hand, the results of OECD's "Programme for International Student Assessment (PISA)", etc., reveal the problem that Japanese children have not properly acquired the willingness and habit to study. This research has also shed light on children's attitudes towards study, which is "it is important to study", but do not necessarily "like to study". Moreover, from lower secondary school 2nd year down, study time per day (on weekdays, other than school hours) is less than 1 hour for about a half of children. Some results suggest that those who answered "I like to study" and those who study longer hours besides school hours get higher scores in tests, and enabling children to acquire the willingness and habit to study is recognized as one of the important issues in improving academic ability. This is also seen from the fact that those with a self-motivated learning attitude who, when "there is something I don't understand in a lesson", "go and ask the teacher after the lesson" or "look into it on my own", get higher scores in tests.
In lower secondary school 3rd year, the learning status is generally better compared to the 1st and 2nd years. It is possible that the entrance examination has an influence over motivation to study, but the ratio of children who think "It is important to study even without relevance to the entrance examination" is quite high on the whole, and it is necessary to note that the ratio is especially high in lower secondary school 3rd year students compared to 1st and 2nd years. Furthermore, the results show that differences in scores of paper tests are bigger between those who did and did not cite, "It gets me a job of my choice" or "It helps in everyday life and in society," as motives to study, than "It helps in entrance examinations." Thus, it seems important for children to develop a sound sense of career for their own future, as well as to understand the relation between study and future career or life in society.
Lastly, as to degree of understanding of school lessons, ratios of children who "understand well" or "understand more or less" are about 60% in primary school and about 40 to 50% in lower secondary school. This, taken together with the above-mentioned research by the Education Ministry in 1998, seems to show situations where considerable numbers of children do not feel they can understand school lessons, presenting an important task to create "lessons that are easy to understand" for children.
| 2) Improvement of teaching, etc. |
A summary of the results of this research is as outlined above. When the results are looked at from the different viewpoints of content, subject areas, or evaluation of each subject, points to be addressed on learning basic and fundamental knowledge, or abilities to think and express are revealed.
These points will be further analyzed so they can be utilized in improving future guidance of study, etc., under the new Courses of Study.
Looking at the correlation of results from the questionnaire on teaching methods by teachers, etc., and the paper tests carried out at the same time, students with guidance by teachers who give homework, offer lessons introducing progressive assignments, provide supplemental teaching, etc., produce higher scores in paper tests. It is expected that each school will continue to aggressively conduct these effective measures.
The research results on forms in teaching show that, while guidance by small-group teaching or team teaching is often conducted, especially in arithmetic/mathematics and English, achievement-based teaching has not been conducted widely yet. Though no difference can be recognized in the results of paper tests regardless of whether these teaching forms are used or not, consideration of an approach for achievement-based teaching, in particular, has just begun. Further enhancement needs to be attempted, paying attention to issues such as development of teaching methods and teaching materials.
Meanwhile, apart from the results of this research, reactions of children, such as "Lessons are fun now" and "Learning is easier than before", are reported from schools that have already implemented achievement-based teaching. It seems necessary for each school to continue to address achievement-based teaching actively, while utilizing outcomes of improvement in teaching methods and development of teaching materials through the "Frontier School for Academic Ability Development", etc.
As already explained, this research has studied the learning status of children under the former Courses of Study until FY 2001. As research under the new Courses of Study, which was enacted from this April, another research project similar to this one is scheduled to be conducted in FY 2003. The status of comprehensive academic ability will be continuously studied in order to obtain positive data to be utilized for the improvement of future school education.
During FY 2002, meanwhile, at least 25 prefectures conducted scholastic tests of their own. In Ishikawa Prefecture, for instance, research has been carried out for primary school 6th graders and lower secondary school 3rd year students to determine their basic academic ability, and schools are endeavoring to improve and substantiate the teaching methods of each subject, etc., by utilizing the results. As for boards of education, they are expected to know the learning status of children through these means, and to make good use of the results to serve in improvement of teaching methods at schools and support measures taken by the boards.
| Back To Top | MEXT HOME |
)
)
)
)
)
)
)
)
)
)