The leading advanced nations are reacting to economic globalization, to the attendant intensification of competition in the global economy, and to the increased importance of energy, food, global environmental problems, and other global and pan-human issues by aggressively promoting science and technology policies toward the assurance of competitive strengths and employment, and toward the resolution of global and pan-human issues.
In Japan, Gross Domestic Product (GDP) growth was limited to 0.5% for fiscal 2004, but R&D expenditure for the year witnessed an increase of 0.8%, a rise for the fifth consecutive year, due to big spending increases by private-sector enterprises, raising the R&D expenditure to GDP ratio by 0.01 points to 3.41%. In addition, the number of researchers in fiscal 2005 increased for the fourth year in a row, with overall R&D-related personnel, including research support staff and technicians, witnessing an increase for the second consecutive year.
R&D expenditures in Japan are therefore clearly rising. This upward trend is a step in the right direction for a Japan that aims to become “an advanced science- and technology-oriented nation.” However, nations around the world are placing an emphasis on science and technology policy and are moving to expand R&D expenditures. If Japan is to continue in the future to enhance its international competitiveness, improve the quality of its people’s lives, as well as respond to global issues, Japan must make continued efforts to strengthen research and development activities, while giving due consideration to its severe fiscal conditions.
Part 2 will compare Japan and major countries(Note 1) in the areas pertaining to science and technology, such as research expenditures and number of researchers, so as to highlight the special characteristics of Japan’s science and technology activities. This information will then be used for a more in-depth analysis of the trends in Japan’s research activities.(Notes 2)
Note 1:
In Part 2, the major countries refers to the United States,
Germany, France, United Kingdom and Japan, unless otherwise noted.
Notes 2:
Part 2 describes research activities including the humanities
and social sciences. Descriptions of the natural sciences alone are annotated.
Furthermore, the classification of the humanities and social sciences as distinct
from the natural sciences is based on the research content, not on the individual
research institute or university and college department concerned.
● International Comparisons of Science and Technology Indicators
A prerequisite for making international comparisons of statistical data is to examine the subject statistical data from each country based on unified standards. The Organisation for Economic Cooperation and Development (OECD) has prepared the Frascati Manual(Notes 3) as a guideline for the collection and analysis of data related to scientific and technological activities, and has asked member countries to base their science and technology indicators on that manual.
In the Frascati Manual, the method for calculating the number of researchers is derived from two types of data ─a simple head count of the number of researchers, and a full-time equivalent (FTE) value(Notes 4), which takes into consideration the proportion of time actually devoted to research activities. The latter is touted in the Manual as being a proper quantitative method for measuring research personnel resources, and all OECD member countries are called upon to support the FTE value.
In Japan, a conversion of various elements has been used to arrive at a number representing the number of full-time researchers, using the “fulltime equivalent ratio” estimated from the results of a survey targeting instructors at universities and colleges taken in 1992 by the Ministry of Education, Culture, Sports, Science and Technology, and the number of researchers and amount of research expenses at universities and colleges from a 2005 survey of research and development (Table 2-1-1).
The FTE differs from the simple head count,especially in the case of researchers at universities and colleges, who are also engaged in teaching activities, and thus, this also changes the corresponding amount of research expenses used at universities and colleges.
In Part 2, we shall use both the simple head count and the FTE value when we make international comparisons of researcher numbers and R&D expenditures for recent years.
Notes 3:
Frascati Manual: A manual for proper international comparisons
of R&D statistics. The original proposal for the first edition of this manual
was made at a meeting in Frascati, Italy, in 1963, and the manual was completed
after discussions and revisions by experts of OECD member countries. Operations
to revise the manual are currently underway. The sixth edition was published
in December 2002.
Notes 4:
FTE value: FTE is an abbreviation for Full Time Equivalent,
and is a converted value showing the actual time engaged in research. If a re-searcher
has an average of 30% of his/her working hours allocated to research and development
operations, and is engaged in other activities (teaching, univer-sity administration,
student counseling, etc.), he/she is said to have a 0.3 FTE. In the same way,
a full-time researcher employed for only six months in research and development
work is said to have a 0.5 FTE.
Table 2-1-1 Comparison of FTE value and simple head count (FY2004)

Notes 1:
The number of researchers is as of March 31, 2005.
Notes 2:
Values for “Total number of researchers” and “Total
R&D expenditure” in the “Simple head count” column are calculated based
on the head count at universities.
Source:
Ministry of Internal Affairs and Communications, Statistics
Bureau (Statistics Bureau)."Report on the Survey of Research and Development"
FTE value:
Statistics Bureau data
● Research and Development in the European Union
The Treaty on the European Union (commonly known as the Maastricht Treaty) was signed in 1992, and the European Union (hereinafter referred to as the EU) was established. The next step in this development was the introduction of a common currency in January 1999, which was followed three years later, in January 2002, with the circulation of Euro-denominated coins and bills in member states. In May 2004, ten central and eastern European countries were granted membership, increasing the number of EU member nations from 15 (EU-15)(Notes 5) to 25 (EU-25)(Notes 6). The EU has demonstrated its important presence in recent years in many arenas on the international stage, rapidly establishing its position as a global player. In terms of science and technology indicators, the EU is second only to the United States. In the future, Japan should not fail to ensure a good relationship with the EU so that Japan can enhance its international com- petitive strength (Table 2-1-2).
The basic objectives of the EU science and technology policy are “strengthening the scientific and technological basis of Community industry and encouraging it to become more competitive at an international level, while promoting all the research activities deemed necessary by virtue of other Chapters of this Treaty” (Treaty Establishing the European Community). Based on these objectives, the Framework Programme (Sixth Framework Programme (FP6), from 2002 to 2006, now in progress) showing the basic framework for research and development activities in the EU was adopted.
While the EU is not included in the international comparisons in this part of this publication, because it is not a nation but rather a community of nation states, indicators for the EU have been included in these comparisons in Part 2 wherever possible, as totals of science and technology indicators(Notes 7) for EU countries.
Notes 5:
The EU-15 consists of Belgium, Germany, France, Italy,
Luxembourg, Netherlands, Denmark, Ireland, United Kingdom, Greece, Portugal,
Spain, Austria, Finland, and Sweden.
Notes 6:
The EU-25 consists of the EU-15 and the following 10 countries:
Cyprus, Czech, Estonia, Hungary, Latvia, Lithuania, Malta, Poland, Slovakia,
and Slovenia.
Notes 7:
EU science and technology indicators: The EU science and
technology indicators used in Part 2 utilize research expenses drawn from data
reported by Eurostat (European Commission Statistics Bureau), numbers of researchers
from data reported by the OECD, and numbers of patent applications and registrations
from WIPO (World Intellectual Property Organization) data.
Table 2-1-2 Comparison of the tripolar world

Notes 1:
Japan population and GDP is for 2005, R&D expenditure
is for FY2004, researchers figure is for 2005.
Notes 2:
Figures in parentheses for R&D expenditure and number
of researchers in Japan are FTE values.
Notes 3:
U.S. population is for 2005, GDP is for 2004, R&D expenditure
is for 2003, researchers figure is for 1999.
Notes 4:
For EU-25 or EU-15, population and GDP is for 2004, R&D
expenditure is for 2003, researchers figure is for 2003.
Notes 5:
The IMF exchange rate is used to convert U.S., EU-25 and
EU-15 currency to Japanese yen.
2.1 R&D Expenditures
2.1.1 Total R&D Expenditures
2.1.1.1 Trends in R&D Expenditures in Selected Countries
When a country examines its R&D expenditures(Notes 8), its statistical contents and approach may differ from other nations. As a result, a simple comparison of R&D expenditures among countries may not pre-sent comparable data, although it gives a general idea as to a country’s attitude towards science and technology. In terms of R&D expenditures, the United States registered the highest total, at 32.9 trillion yen at the IMF currency conversion rate (39.5 trillion yen at the OECD purchasing power parity conversion rate), followed by the EU-25 at 24.6 trillion yen at an IMF exchange rate conversion (29.5 trillion yen in OECD purchasing power parity), and Japan at 16.9 trillion yen (or 15.8 trill- ion yen at the FTE value) (Figure 2-1-3).
Notes 8:
Definition of R&D expenditures: In the “Report on the
Survey of Research and Development” by the Statistics Bureau of the Ministry
of Internal Affairs and Communications, “research” is defined as “creative
efforts and investigations conducted to obtain new knowledge about things, functions,
and phenomena, or to open paths toward new applications of existing knowledge.”
All outlays incurred for these activities (labor costs, materials, expenditures
on tangible fixed assets, etc.) are treated as research expenditures.
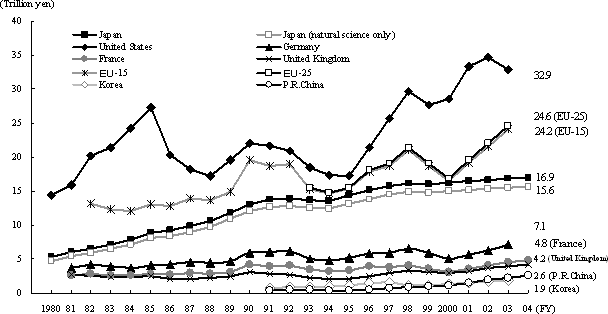
Figure 2-1-3 (1) Trends in R&D expenditures of selected countries -IMF exchange rate conversion
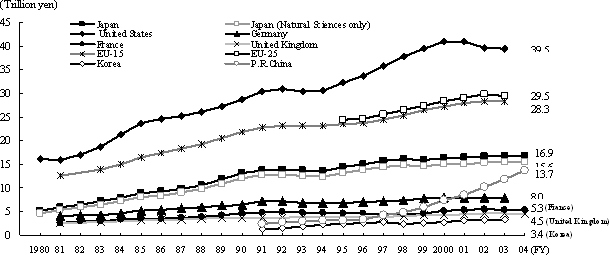
Figure 2-1-3 (2) Trends in R&D expenditures of selected countries -OECD purchasing power parity
Notes 1:
For comparison purposes, statistics for all countries
(excluding South Korea) include research in social sciences and humanities.
The
figure for Japan shows also the amount for natural sciences only.
Notes 2:
Japan added industries as new survey targets in FY1996
and FY2001.
Notes 3:
U.S. figures for 2002 and later are provisional.
Notes 4:
French figure for FY2004 is provisional.
Notes 5:
The EU figures converted at the IMF currency conversion
rate are estimates by Eurostat, while the figures based on the purchasing power
parity conversion are OECD estimates.
Notes 6:
EU-15 consists of 15 countries: Belgium, Germany, France,
Italy, Luxembourg, Netherlands, Denmark, Ireland, United Kingdom, Greece, Portugal,
Spain, Austria, Finland, and Sweden.
Notes 7:
The EU-25 consists of the EU-15 and the following 10 countries:
Cyprus, Czech, Estonia, Hungary, Latvia, Lithuania, Malta, Poland, Slovakia,
and Slovenia.
Source:
Japan-Statistics Bureau. "Report on the Survey of
Research and Development"
United States-National Science Foundation.
"National Patterns of R&D Resources"
Germany-Federal Ministry
of Education and Research. "Bundesbericht Forschung"
France-"Project
de Loi de Finance: Rapport annexe sur l' Etat de la Recherche et du Developpement
Technologique"
United Kingdom-Office for National Statistics.
"Gross Domestic Expenditure on Research and Development"
EU-Database
on website of Eurostat (Statistical Office of the European Communities, hereinafter
abbreviated)
China and South Korea-OECD. "Main Science and Technology
Indicators"
2.1.1.2 Increase of R&D Expenditures in Real Terms
R&D expenditures in real terms for selected countries are calculated in order to compare national growth rates. The trend in the past decade shows the United States, Germany(Notes 9) and Japan registering high growth, and China and South Korea registering phenomenal growth. Japan reflects expansion in private-sector companies’ research and development investment, which registered ten straight years of growth beginning in fiscal 1995 (Figure 2-1-4).
Notes 9:
Germany: The data for Germany in Chapter 2.1 and 2.2 cover
Western Germany only until 1990, and Unified Germany from 1991. In Chapter 2.3,
Germany before fiscal 1990 refers to a combination of the figures of West and
East Germany.
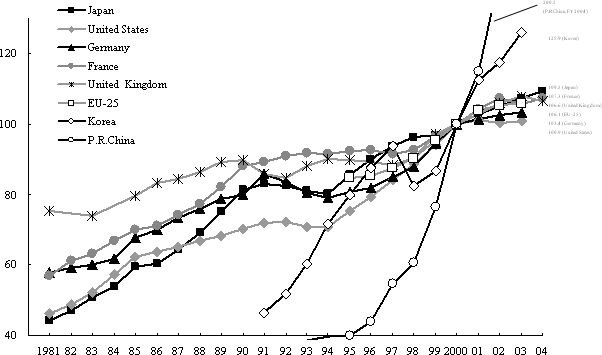
Figure 2-1-4 Growth of R&D expenditures (in real terms) in selected countries,with FY1995 as 100
Notes 1:
For comparison, statistics for all countries include research
in social sciences and humanities.
Notes 2:
Japan added industries as new survey targets in FY1996
and FY2001.
Notes 3:
U.S. figure for 2002 is provisional.
Notes 4:
France figure for 2004 is provisional.
Notes 5:
EU figures are Eurostat estimates.
Source:
GDP deflator-OECD. "Main Science and Technology Indicators"
Others-Same as in Figure 2-1-3.
2.1.1.3 R&D Expenditures as a Percentage of Gross Domestic Product (GDP)
Taking a look at the ratio of research expenditure to GDP as an indicator of nationwide R&D investment level, although decreases were observed in all countries in the early 1990s, the ratio started to increase in Japan and the United States in fiscal 1995 and in European countries a little later. Japan continues to maintain the highest standard among the major advanced nations, at 3.35% of GDP in fiscal 2003 (3.13%, using the FTE) (Figure 2-1-5).
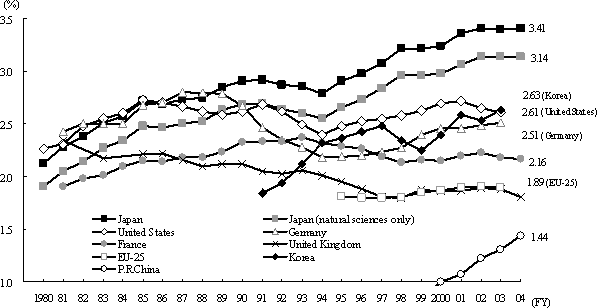
Figure 2-1-5 R&D expenditures as a percentage of GDP in selected countries
Notes 1:
For comparison, statistics for all countries (excluding
South Korea) include research in social sciences and humanities. The figures
for Japan show also the amount for natural sciences only.
Notes 2:
Japan added industries as new survey targets in FY1996
and FY2001.
Notes 3:
U.S. figures for 2002 is provisional.
Notes 4:
French figure for FY2004 is provisional.
Notes 5:
EU figures are Eurostat estimates.
Source:
Same as in Figure 2-1-3.
2.1.2 R&D Expenditures by Financing and Performance
R&D expenditures can be characterized by the financing and performance aspects of categorized sectors. The statistics compiled by the OECD categorize sectors into government(Notes 10), industry, universities and colleges, private research institutions, and overseas. Shares of R&D expenditures by financing and performance in selected countries are compared by OECD-categorized sectors.
Notes 10:
Government:In Chapters 2.1 and 2.2, when research expenses
and numbers of researchers are expressed, “governments” means central governments,
local government (in the case of Japan, local public bodies), and its agencies
concerned.
2.1.2.1 Share of R&D Expenditures
A look at the share of total research expenditures held by governments shows France with the highest percentage, at about 40% of expenditures. Japan’s share shows the lowest level among selected countries, a figure that is probably affected by such factors as the extremely low share held by defense research and by the large amount of activity in the private sector (Figure 2-1-6). The large share of R&D expenditures carried by the private sector means that the figures tend to be easily swayed by fluctuations in the business environment (Figure 2-1-7).
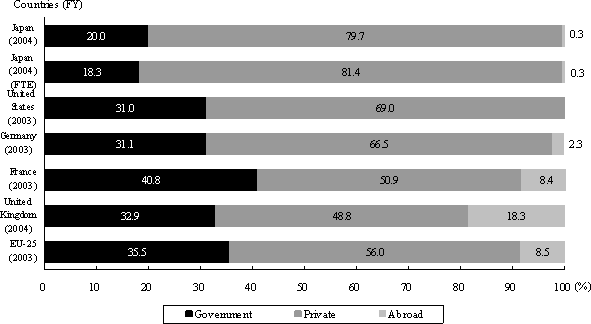
Figure 2-1-6 Share of R&D expenditures by financing sector in selected countries
Notes 1:
For comparison, statistics for all countries include research
in social sciences and humanities. The figure for Japan includes the FTE value.
Notes 2:
Japan's FTE value is calculated by the Ministry of Education,
Culture, Sports, Science and Technology (MEXT) based on the Statistics Bureau
data.
Notes 3:
U.S. figures are provisional.
Notes 4:
Everything other than government and abroad is classified
as private sector.
Notes 5:
EU figures are OECD estimates.
Source:
EU- OECD. "Main Science and Technology Indicators"
Others- Same as in Figure 2-1-3.

Figure 2-1-7 Trends in overall growth in R&D expenditures, and gross domestic product (GDP) growth rates
Source:
Cabinet Office, Economic and Social Research Institute.
"Annual Report on National Accounts", "Quarterly Estimates of
GDP (preliminary Report)" Statistics Bureau. "Report on the Survey
of Research and Development"
The decline in defense-related R&D expenditures since the end of the Cold War structure has resulted in a gradual, continuous decline in the share of R& D expenditures financed by governments in other countries, although it has been on the rise in the United States and France in recent years. The share of R&D expenditures financed by the Japanese government has declined slightly for the fifth straight year (Figure 2-1-8).
For the government share of expenditures in relation to gross domestic product (GDP), France had the highest percentage, followed in order by the United States, Germany, Japan, and the United Kingdom. The shares for the United States, Germany and France have been increasing, while that for Japan has remained flat (Figure 2-1-9).
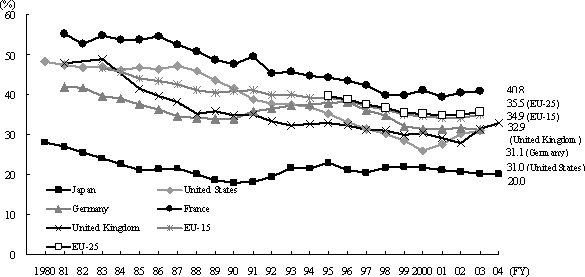
Figure 2-1-8 (1) Trends in government-financed R&D expenditures-Share of R&D expenditures financed by government
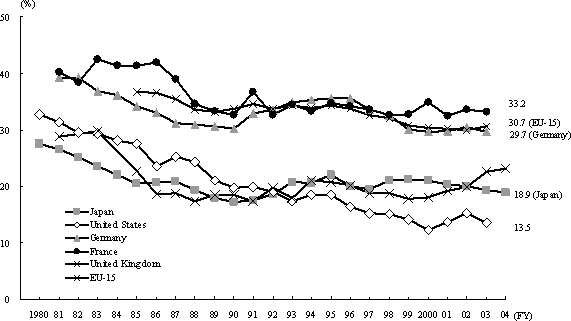
Figure2-1-8 (2) Trends in government-financed R&D expenditures -Share of R&D expenditures exclusive of defense-related R&D expenditures
Notes 1:
For comparison, statistics for all countries include research
in social sciences and humanities.
Notes 2:
Government percentages exclusive of defense-related research
expenditures are calculated by the following equation.
![]()
The national budget for defense-related R&D was used to derive the defense-related R&D expenditure. Therefore, this indicator should only be treated as a reference. It should be noted that the results of defense-related R&D often not only affect defense but also contribute to the development of science and technology for the civil welfare.
Notes 3:
Japan added industries as new survey targets in FY1996
and FY2001.
Notes 4:
U.S. figures for FY2002 and later are provisional.
Source:
Defense-related R&D expenditures in Japan-MEXT. "Budget
for Science and Technology".
Defense-related R&D expenditures
in the U.S.-The Budget of the U.S. Government
Defense-related R&D
expenditures in the U.K.-"SET Statistics".
Others -Same as
in Figure 2-1-3
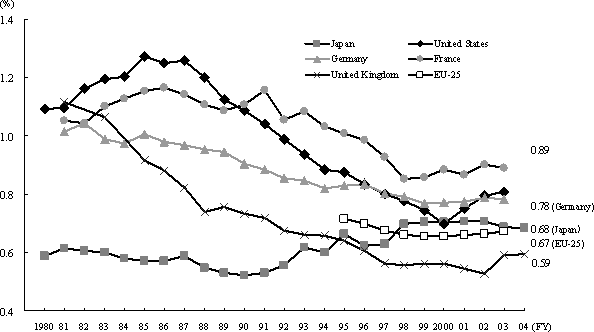
Figure 2-1-9 Trends in the proportion of government-financed R&D expenditures to gross domestic product (GDP) in selected countries
Notes 1:
For comparison, statistics for all countries include research
in social sciences and humanities.
Notes 2:
Japan added industries as new survey targets in FY1996
and FY2001.
Notes 3:
U.S. figures for 2002 is provisional.
Source:
Same as in Figure 2-1-3.
2.1.2.2 Share of R&D Expenditures by Performance
Industry spends approximately two-thirds of total R&D expenditures in all selected countries, demonstrating just how large a role private-sector companies play in research and development. Among the selected countries, government research institutions’ share of R&D expenditures was highest in France (Figure 2-1-10).
In the selected countries, the trends in real R&D expenditures by type of organization reveals that industry has contributed the most greatly in all countries to growth in R&D expenditures (Figure 2-1-11).
In Japan, a look at the contribution by type of organization to year-on-year growth of R&D expenditures (in real terms) shows that R&D expenses at private companies have a large effect on trends in Japan’s R&D expenses. For the degree of contribution, private companies made a positive contribution from fiscal 1995 to fiscal 1998, but then fell into a negative contribution for fiscal 1999. Private companies returned to a positive contribution in fiscal 2000 (Figure 2-1-12).
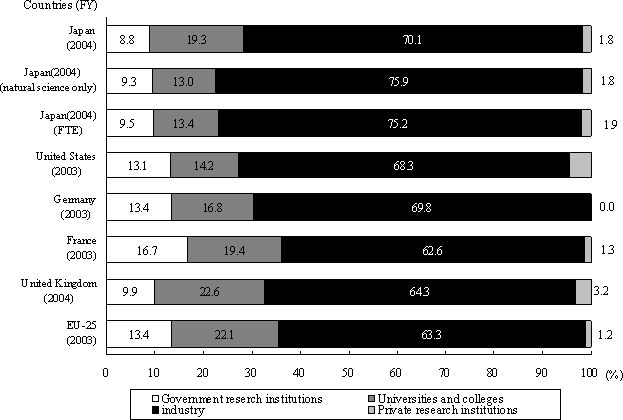
Figure 2-1-10 Share of R&D expenditures by performance sector in selected countries
Notes 1:
For comparison, statistics for all countries include research
in social sciences and humanities.
The figures for Japan show also
the amount for natural sciences only and FTE value.
Notes 2:
Figures for Japan's FTE value are prepared from the Statistics
Bureau data.
Notes 3:
U.S. figures are provisional. In addition, Germany's research
expenditures at "private research institutions" are included in "government"
research institutions.
Source:
France-OECD. "Main Science and Technology Indicators"
Others-Same
as in Figure 2-1-3.
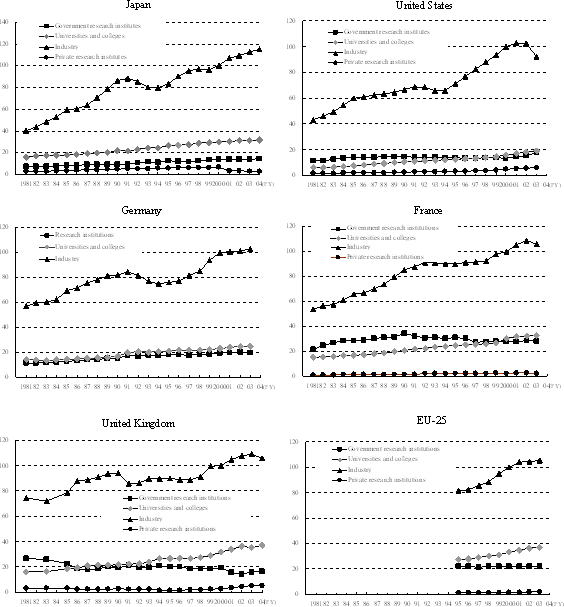
Figure 2-1-11 R&D expenditures growth (in real terms) by sector in selected countries
Notes 1:
All countries include social sciences and humanities for
purposes of international comparison. In addition, industry's real research
expenditures for FY2000 are set at 100.
Notes 2:
U.S. data are for FY2003 is provisional.
Notes 3:
Since no differentiation has been made between "government
research institutions" and "private research institutions" in
Germany, they are listed simply as "research institutions."
Notes 4:
Japan added some industries as new survey targets in FY1996
and FY2001.
Notes 5:
EU figures are Eurostat estimates.
Source:
France- OECD. "Main Science and Technology Indicators"
Others-
Same as in Figure 2-1-3.
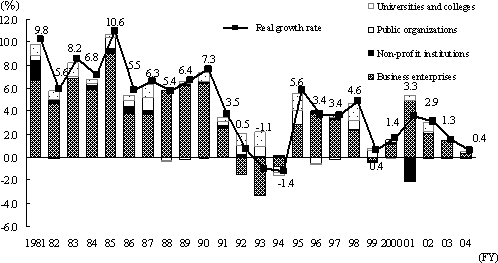
Figure 2-1-12 The contribution by organization to the year-on-year growth rate in Japan's real R&D expenditures
Notes 1:
The deflation referring for each sector is based on FY2000.
Notes 2:
Japan added some industries as new survey targets in FY1996
and FY2001.
Notes 3:
Survey coverage categories were changed in FY2001; figures
up to FY2000 are for the following categories:

Source:
Statistics Bureau. "Report on the Survey of Research
and Development", data of Statistics Bureau
2.1.2.3 R&D Expense Flows
Japan’s R&D expense flows between sources of funding and sectors of performance reveal that about 48% of government funding goes to universities, about 44% to government research institutions, and about 9% to the private sector. In private-sector funding, by contrast, about 98.8% goes to the private sector, with about 1.0% to universities and about 0.2% to government research institutions.
Comparing flows of R&D expenditures between the financing and performance sectors shows that in Japan there is a lesser flow of R&D expenditures between sectors (government, industry, universities and colleges) than exists in other countries. The ratio of private sector R&D expenditures funded by government is high in the United States and in the United Kingdom. The United Kingdom is characterized by a large proportion of R&D expenditures being borne from abroad (Figure 2-1-13).
On the reason why R&D expenses flow from government to the private sector, and from the private sector to universities, are so low in Japan, it can be pointed out that research and development in Japan often relies more on private-sector activities than it does in other countries. The large flows from government to the private sector in the United States, the United Kingdom, and elsewhere are due to the large flows of aerospace research and defense research funds. Moreover, a major reason for the large flow of research funds from foreign countries into the United Kingdom is likely the existence in that country of many foreign-capitalized corporations with research and development centers in operation, which would therefore be sending R&D funds to the United Kingdom from their own home countries.
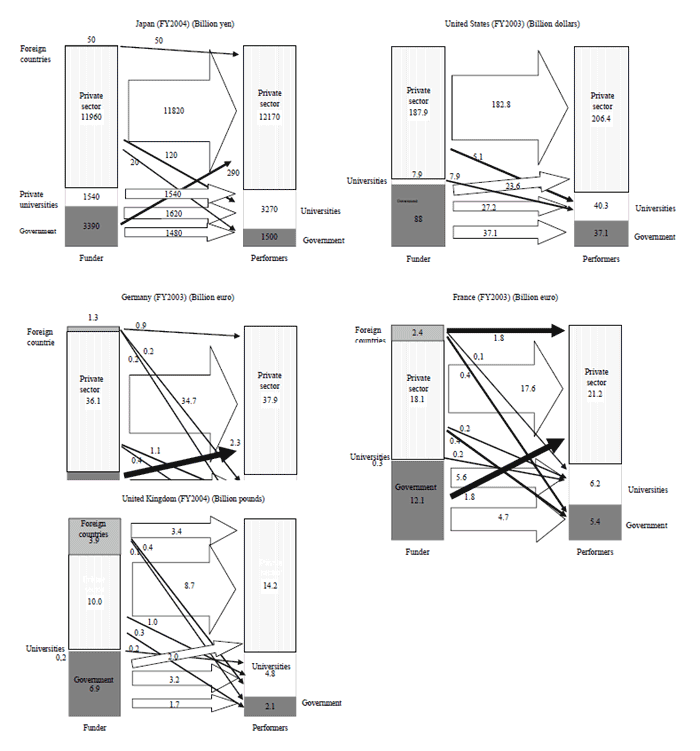
Figure 2-1-13 R&D expense flows in selected countries
Notes 1:
For comparison, statistics for all countries include research
in social sciences and humanities.
Notes 2:
U.S. figures are for calendar years and provisional.
Notes 3:
In Germany, data from private research institutions are
included in the government figures, and in the other countries are included
in the private sector.
Source:
France- OECD. "Research and Development Statistics"
Other countries- Same as in Figure 2-1-3.
2.1.3 R&D Expenditures per Researcher
Because of differences in how researchers are targeted, in survey methods used, and in ex-change rates, simple comparisons between countries of R& D expenditures per researcher may not be precise. Nevertheless, a look at statistics for five major countries shows Japan ranked fourth when the yen was converted to the IMF exchange rate, and ranked last when the OECD’s purchasing power parity conversion rate was used (Figure 2-1-14).
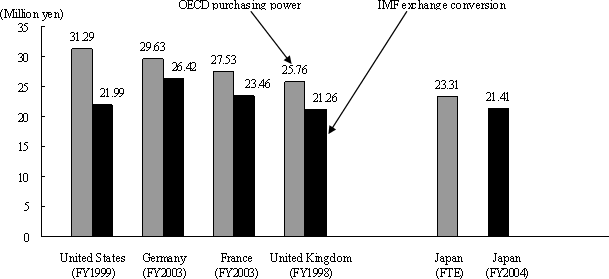
Figure 2-1-14 R&D expenditures per researcher
Notes 1:
For comparison, figures for all countries include social
sciences and humanities. The figure for Japan includes the FTE value.
Notes 2:
The FTE values for Japan were estimated by the Ministry
of Education, Culture, Sports, Science and Technology based on data issued by
the Statistics Bureau of the Ministry of Internal Affairs and Communications.
Source:
Same as in Figure 2-1-3.
Japan’s R&D expenditures per researcher have been hovering around 22 million yen in recent years.
For R&D expenditures per researcher by type of organization in fiscal 2004, public organizations and non-profit institutions with high ratios of non-personnel R&D expenditures also registered high R&D expenditures per researcher, while universities and colleges, where the ratio of non-personnel R&D expenditures were low, registered lower expenditures per researcher (Figure 2-1-15).
If we limit the R&D expenditures per re-searcher at universities and colleges to those invested in those teachers, then the national universities with particularly high non-personnel R&D expenditures have the highest expenditures per researcher, followed by private universities and other public universities. By specialty (academic field), the rankings were, in order, physical science, engineering, agricultural sciences, and health sciences (Figure 2-1-16).
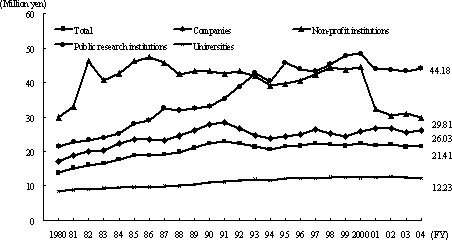
Figure 2-1-15 (1) Trends in R&D expenditures per researcher (in nominal terms)
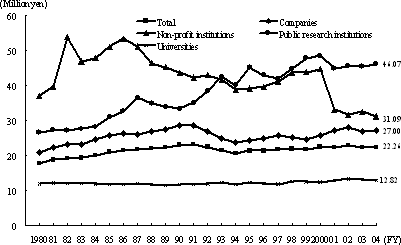
Figure 2-1-15 (2) Trends in R&D expenditures per researcher (in real terms)
Notes 1:
Survey coverage categories were changed in FY2001; figures
up to FY2000 are for the following categories:

Notes 2:
Figures for universities, the total, business enterprises
(companies), private non-profit institutions (private research institutions),
and public organizations (government research institutions) up to fiscal 2000
are based on the number of regular researchers.
Notes 3:
Real values are calculated using the R&D expenditure
deflator with fiscal 2000 as the base year.
Source:
Statistics Bureau. "Report on the Survey of Research
and Development", Data of the Statistics Bureau
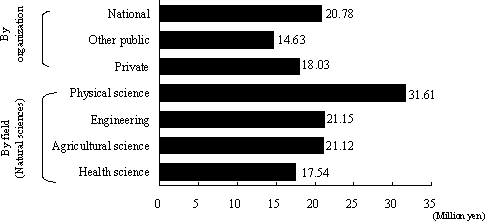
Figure 2-1-16 R&D expenditures per researcher at universities and colleges (FY2004)
Notes 1:
Figures by organization include the humanities and social
sciences.
Notes 2:
Figures are for faculty members only, out of all researchers.
Notes 3:
The number of researchers is as of March 31, 2005.
Source:
Statistics Bureau. "Report on the Survey of Research
and Development"
2.1.3.1 R&D expenditures per Researcher, by Type of Industry
For R&D expenditures per researcher by type of industry, the top five industrial categories were led by the telecommunications industry, with its high purchase rate for large machinery, equipment, facilities, and other tangible fixed assets, followed by the pharmaceutical industry, the broadcasting industry, the transportation industry and the automobile industry (Figure 2-1-17).
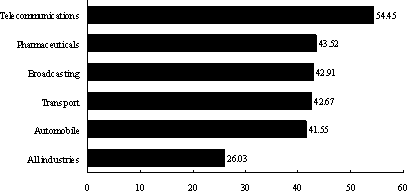
Figure 2-1-17 R&D expenditures per researcher, by industry(top five industrial categories) (FY2004)
Note:
The number of researchers is as of March 31, 2005.
Source:
Statistics Bureau. "Report on the Survey of Research
and Development"
2.1.4 R&D Expenditures by Character of Work
Classification into basic research, applied research, and development(Notes 11), may differ from country to country. Although it is difficult to make a comparison due to differences in distinctions between the three among the countries concerned, R&D expenditure data by character of work generally reflects the R&D activity of each country.
Recent statistical data for Japan, the United States, Germany and France shows that France and Germany spend more on basic research, and that Japan spends less on basic research (Figure 2-1-18).
Notes 11:
Research classification: “Report on the Survey of Research
and Development” by the Statistics Bureau defines research by type of characteristics
as follows:
- Basic research: Basic or experimental research conducted with no direct consideration for specific applications or uses, in order to form hypotheses or theories, or to obtain new knowledge about phenomena or observable reality.
- Applied research: Research that utilizes knowledge discovered through basic research to confirm the feasibility of commercialization for a specific objective, and research that searches for new applications for methods that have already been commercialized.
- Experimental development: Research that utilizes knowledge obtained from basic research, applied research, or actual experience for the objective of introducing new materials, devices, products, systems, processes, etc., or of making improvements to those already existing.
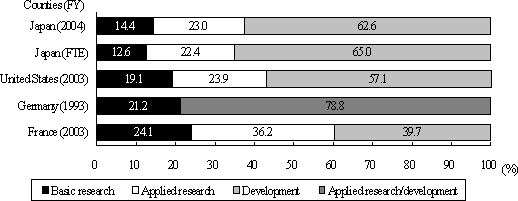
Figure 2-1-18 R&D expenditures by character of work in selected countries
Notes 1:
Figures for Japan's FTE value are prepared from Statistics
Bureau data.
Notes 2:
There is no distinction in Germany between applied research
and development.
Source:
Japan, U.S.─Same as in Figure 2-1-3.
Germany,
France─OECD." Research and Development Statistics "
A look at the trend for the share held by basic research in selected countries shows that Japan’s allotment for basic research slightly tended to rise in fiscal 1998, but then turned downward in fiscal 2004. The United States, while showing some minor fluctuations, has generally increased its share of basic research since fiscal 1986 (Figure 2-1-19).In Japan, research expenses in the different types of organizations, classified into companies, research institutions, and universities and colleges, are clearly differentiated in structure. For companies, development plays an extremely important role due to their corporate business functions, and this trend has become even more intensified in recent years. On the other hand, universities and colleges place emphasis on basic research and applied research. Non-profit institutions and public organizations, meanwhile, both exhibit intermediate trends (Figures 2-1-20, 21).
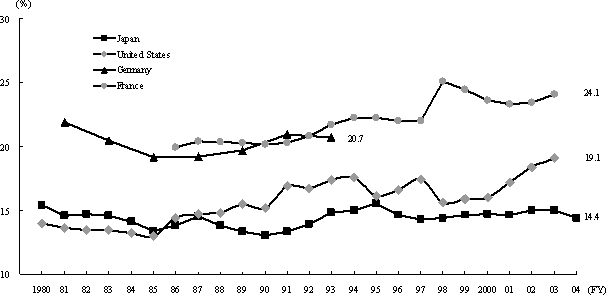
Figure 2-1-19 Trends in the proportion of basic research expenditures in selected countries
Source:
Japan, United States-same as in Figure 2-1-3.
Germany,
France-OECD. " Research and Development Statistics "
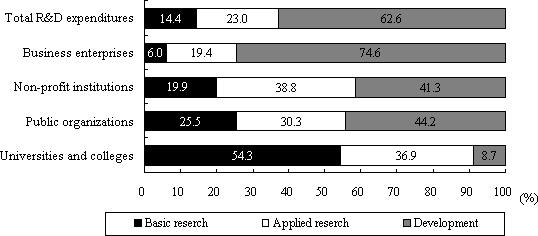
Figure 2-1-20 Composition of R&D expenditures by character of work by sector in Japan (FY2004)
Note:
The figures are for the composition of R&D expenditures
by character of work in the natural sciences (physical science, engineering,
agricultural science, and health science).
Source:
Statistics Bureau. "Report on the Survey of Research
and Development"
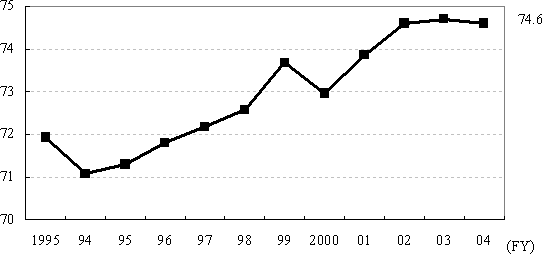
Figure 2-1-21 Trend in the share of development expenditures out of total research expenditures of companies
Note:
The share of research expenditures in only for the natural
sciences.
Source:
Statictics Bureau. "Report on the Survey of Research
and Development"
2.1.5 R&D Expenditures by Industry
2.1.5.1 R&D Expenditures by Industry
While the statistical survey range varies from country to country, making simple comparisons difficult, it is plain that research expenses in the service industry have been increasing in all countries since the mid-1980s, in response to the shift of industrial structure from manufacturing to services in major countries. The figures for services are particularly high in the United States and the United Kingdom (Figure 2-1-22).
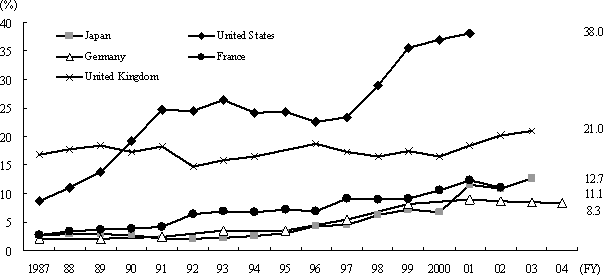
Figure 2-1-22 Share of services industry in total R&D expenditures
Notes 1:
For purposes of international comparison, the figures
for each country include the humanities and social sciences.
Notes 2:
Japan added some industries as new survey targets in FY1996
and FY2001.
Source:
OECD."Research and Development Statistics"
2.1.5.2 R&D Expenditures by Type of Manufacturing Industry
For the top six R&D expenditure manufacturing industry sectors in major countries, all countries showed high ratios for the electronics industry, the automobile industry, and the pharmaceuticals industry, which are all subject to severe competition internationally. For the total share of the top three industries, the information and telecommunications machinery and equipment industry, the automobile industry, and the electrical machinery and apparatuses industry accounted for 48.0% of the total in Japan; in the United States, the chemical industry, the precision instrument, and the automobile industry accounted for 49.6%; in Germany, the automobile industry, other machinery industries, and the electronics industry, accounted for 55.4%; in France, the automobile industry, the electronics industry, and the pharmaceuticals industry accounted for 47.9%; and in the United Kingdom, the pharmaceuticals industry, the aerospace industry, and the automobile industry accounted for 57.6% of the total. In all major countries, therefore, R&D expenses are concentrated in the top-ranking industries (Figure 2-1-23).
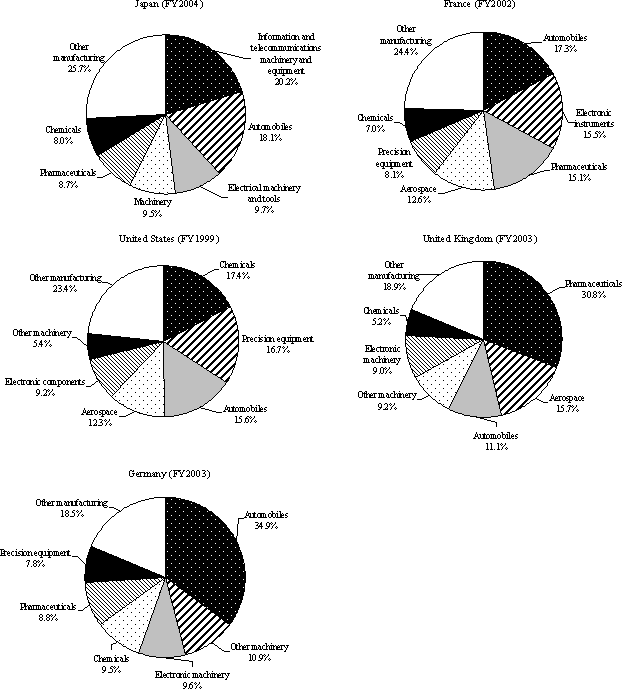
Figure 2-1-23 Manufacturing industry research expenditures in selected countries, by Industry
Source:
Japan-Statistics Bureau. "Report on the Survey of
Research and Development"
Other countries-OECD. " Research
and Development Statistics "
2.1.6 R&D Expenditures in Japan by Sector
The following section gives R&D expenditures in Japan by sector(Notes 12) on the basis of the Survey of Research and Development (2005) conducted by the Ministry of Internal Affairs and Communications.
Notes 12:
Research Performing Sector: Research activities in Japan
in this paper are provided by business enterprises, public organizations, non-profit
institutions, and universities and colleges. These classifications are based
on the “Report on the Survey of Research and Development” compiled by the
Statistics Bureau. The following defines some of these organizations.
2.1.6.1 Business Enterprises(Notes 13)
According to the survey, the business enterprises that engaged in research in fiscal 2004 numbered 24,000 companies, with the manufacturing industry accounting for the vast majority of these, at almost 72.0% of all industry types. Within the manufacturing sector, the fabricated metal products, machinery, and electrical machinery and tools industry held the largest shares.
Also, the total of R&D expenses incurred by companies in fiscal 2004 rose by 0.9% from the previous fiscal year to 11.8673 trillion yen, accounting for about 70.1% of Japan’s total R&D expenditures.
By source of funding for R&D expenditures, companies accounted for almost all of the total, dwarfing the government funding of about 1.3% of the total.
Moreover, for R&D expenses incurred by companies excluding public corporations and incorporated administrative agencies, classified by company capitalization, those with a capitalization of 10 billion yen or more accounted for 71.4% of the total, a result that showed R&D expenditures were concentrated in larger corporations. Furthermore, growth rates since fiscal 2003 show that companies with a capitalization of 100 million yen and less have experienced declines while companies with a capitalization of more than 100 million yen have witnessed year-on-year increases (Table 2-1-24).
Notes 13:
Business enterprises: Corporate companies (Capital:
1 million or more yen (fiscal 1974 or before), Capital: 300 million yen or
more (between fiscal 1975 and fiscal 1978), Capital: 5 million yen or more
(between fiscal 1979 and fiscal 1993), Capital: 10 million yen or more (fiscal
1994 and after)), profit-oriented public corporations and independent administrative
institutions. The public corporations and independent administrative institutions
specializing in research are excluded, and are included in the research institutions
defined below.
Table 2-1-24 R&D expense growth rates and component ratio, by size of company pitalization

Source:
Statistics Bureau. "Report on the Survey of Research
and Development"
2.1.6.2 Non-profit Institutions(Notes 14)
In fiscal 2004, the government and the private sec-tor were sources for nearly equal shares of funding for non-profit institutions. The total R&D expenditures at non-profit institutions were 298.8 billion yen, accounting for about 1.8% of Japan’s total R&D expenditures (Figure 2-1-25).
Notes 14:
Non-profit institutions: Corporations, groups, etc. such
as incorporated foundations or incorporated bodies that carry out research and
do not seek private profit.
2.1.6.3 Public Organizations(Notes 15)
The government was the source for nearly all R&D expenditures at public organizations in fiscal 2004, with private-sector funding accounting for only about 1.0%.
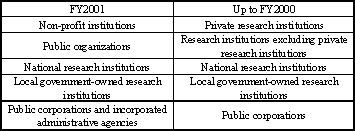
Total R&D expenditures at government research institutions increased by 2.6% over the previous fiscal year to 1.4975 trillion yen, representing 8.8% of Japan’s total R&D expenditures. When looking at expenditures by type of institution, national government-owned institutions, publicly-owned research institutions, and public corporations and incorporated administrative agencies witnessed yearon-year declines (Figure 2-1-25).
Notes 15:
Public organizations: National and local government-owned
research institutions and public corporations and independent administrative
institutions whose primary business is research and development.
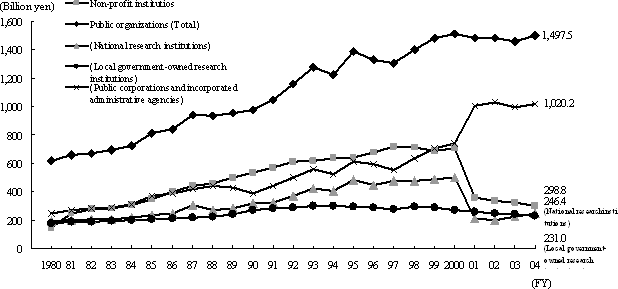
Figure 2-1-25 Trends in R&D expenditures for non-profit institutions and public organizations
Note:
Survey coverage categories were changed in FY2001; figures
up to FY2000 are for the following categories:
Source:
Statistics Bureau. "Report on the Survey of Research
and Development"
2.1.6.4 Universities and Colleges(Notes 16)
By source of funding for R&D expenditures at universities and colleges in fiscal 2004, the government accounted for about 50% of the total. The total R&D expenditures at universities and colleges increased by 0.3% over the previous fiscal year to 3.2740 trillion yen, accounting for 19.3% of Japan’s total R&D expenditures.
For trends in R&D expenditures by type of univesity, national and private universities registered year-on-year increases. Likewise, by type of field, agricultural sciences and health sciences registered year-on-year increases, but physical sciences and engineering registered decreases (Figure 2-1-26).
Notes 16:
Universities and colleges: Departments of universities
and colleges (including graduate schools), junior colleges, colleges of technology,
research institutions attached to the universities and colleges and inter-university
research institutes, National Institution for Academic Degrees and University
Evaluation, Center for National University Finance and Management, and National
Institute of Multimedia Education.
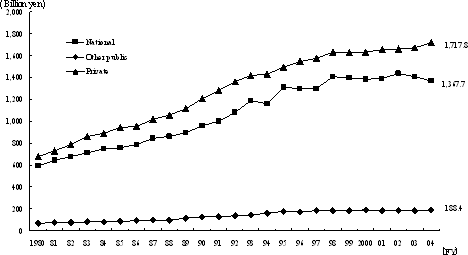
Figure 2-1-26 (1) Trends in R&D expenditures at universities and colleges, by type of university
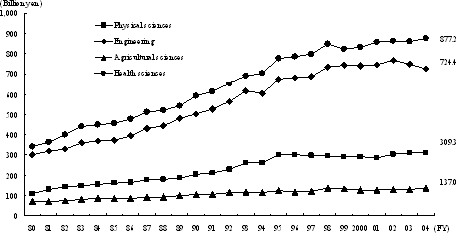
Figure 2-1-26 (2) Trends in R&D expenditures at universities and colleges, by field
Note:
The figures by type of university include the humanities
and social sciences.
Source:
Statistics Bureau. "Report on the Survey of Research
and Development"
2.1.7 R&D Expenditures in Japan by Type
R&D expenditures break down into labor costs, materials, expenditures on tangible fixed assets (land and buildings, machinery, instruments, equipment and others), and lease fees (separated from ‘Other expenses’ in fiscal 2001) and other expenses.
An examination of Japan’s R&D expenditures by type reveals that total labor costs in fiscal 2004 decreased by 0.3% over the previous fiscal year to 7.6115 trillion yen. The total expenditures for mate- rials increased by 1.1% over the previous fiscal year to 2.8169 trillion yen. The total expenditures for tangible fixed asset purchases decreased, registering a 10.1% decrease over the previous fiscal year to 1.5627 trillion yen. On the other hand, the total expenditures for lease fees decreased by 1.4% over the previous fiscal year to 178.4 billion yen. The share of other expenses required for research, such as books and journals, utilities, travel, and telecommunications, etc., increased by 6.7% over the previous fiscal year to 4.7681 trillion yen (Figure 2-1-27).
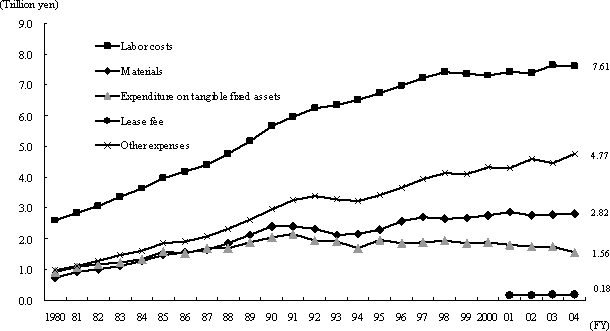
Figure 2-1-27 Trends in R&D expenditures by type
Notes 1:
The humanities and social sciences are included.
Notes 2:
Lease fee was separated from ‘Other expenses’ in FY2001.
Notes 3:
Some Industries were added as new survey targets in FY1996
and FY2001.
Source:
Statistics Bureau. "Report on the Survey of Research
and Development"
Moreover, the trends in the breakdown of expenditures reveal that while labor cost has long held the largest share of overall expenditures, that share has stayed flat in recent years. Material costs have also stayed flat. Tangible fixed asset purchase expenditures are declining. The shares of other expenditures are increasing (Figure 2-1-28).
By category in fiscal 2004, company R&D expenditures were characterized by decreases in labor costs, tangible fixed assets and lease fees, and rises in material costs and other expenditures (Figure 2-1-29).
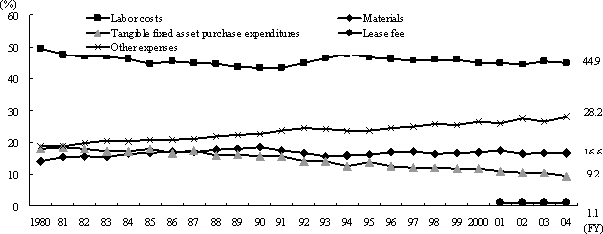
Figure 2-1-28 Trends in R&D expenditures by constituent elements
Notes 1:
The humanities and social sciences are included.
Notes 2:
Lease fee was separated from ‘Other expenses’ in FY2001.
Notes 3:
Some Industries were added as new survey targets in FY1996
and FY2001.
Source:
Statistics Bureau. "Report on the Survey of Research
and Development"
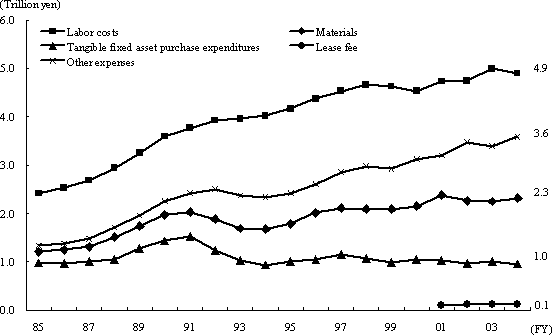
Figure 2-1-29 Trends in R&D expenditures at business enterprises, by type
Notes 1:
Lease fee was separated from ‘Other expenses’ in FY2001.
Notes 2:
The software industry and wholesale trade were newly added
to the scope of the survey in 1996 and 2001, respectively.
Source:
Statistics Bureau. "Report on the Survey of Research
and Development"
Non-profit institutions and public organizations had lower ratios than any other institutions on expenditures for labor costs, while their tangible fixed asset purchase expenditures showed higher ratios. When looking at expenditures by type of institution, local government-owned institutions were chara- cterized by exceptionally high labor costs. On the other hand, public corporations and incorporated administrative agencies have higher ratios of expenditures for the purchase of tangible fixed assets, because they include those requiring large-scale facilities and equipment for nuclear and space R&D (Figure 2-1-30).
Universities and colleges had a higher share of labor costs than other institutions, accounting for 65.9% of expenditures, while raw material costs were the lowest in share. When looking at expenditures by the field of study within the natural sciences, the physical sciences in particular had lower than average shares of labor costs tended to require larger than average shares of total costs for tangible fixed as-sets (Figure 2-1-31).

Figure 2-1-30 Composition of research expenditures at non-profit institutions and public organizations by type (FY2004)
Source:
Statistics Bureau. "Report on the Survey of Research
and Development"
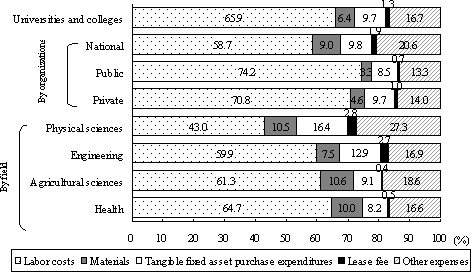
Figure 2-1-31 Composition of R&D expenditures at universities and colleges, by type (FY2004)
Note:
The figures for all universities and colleges and those by
organization include the humanities and social sciences.
Source:
Statistics Bureau. "Report on the Survey of Research
and Development"
Contacts
Research and Coordination Division, Science and Technology Policy Bureau
(Research and Coordination Division, Science and Technology Policy Bureau)


