2.2 Research Personnel
Statistics on research personnel, along with those on R&D expenditures, are another effective indicator of the extent of research activities. Personnel engaged in R&D(Notes 17) can be classified as researchers and support personnel (assistant research workers, technicians, and clerical and other supporting personnel).
Notes 17:
Research personnel:
“Report on the Survey of Research and Development” compiled by the Statistics
Bureau classifies personnel engaged in R&D as follows. (2002 revision)
Researcher:
Persons who hold a university degree (or persons who have equivalent or
greater knowledge in their specialty), who are engaged in research activities
in their own chosen subject. “Researchers” as used herein, refers only to
full-time researchers, and excludes those who also perform other duties in addition
to research.
Assistant research workers:
Persons who assist researchers and who are engaged in research activities
under their direction and who have the possibility of becoming researchers in
the future.
Technicians:
Persons, other than researchers and assistant research workers, who are engaged
in technical services related to research activities under the guidance and
supervision of researchers and assistant research workers.Clerical and other
supporting personnel: Excepting those mentioned above, persons who are engaged
in miscellaneous activities, clerical work, accounting, etc., relating to research
activities. Japanese statistics on persons engaged in R&D are as of April 1
of the appropriate year up to 2001, and as of March 31 for 2002.
2.2.1 Researchers
2.2.1.1 Number of Researchers
Countries use different methods for determining the number of researchers. The Frascati Manual defines researchers as “professionals engaged in the conception or creation of new knowledge, product processes, methods, and systems, and in the management of the projects concerned.” But this definition is quite vague, and countries that follow the Frascati Manual also specify their own definitions of the term “researcher” for counting researchers.
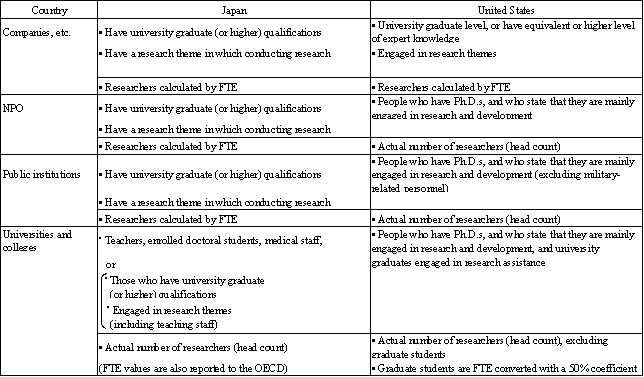
For this reason, there are differences between countries in methods for measuring the number of researchers, and international comparisons are difficult. In comparison between Japan and the United States, the number of researchers counted in the Report on the Survey of Research & Development conducted by the Statistics Bureau of Japan’s Ministry of Internal Affairs and Communications is not exactly equivalent to the researchers counted in the U.S. National Science Foundation’s National Patte- rns of R&D Resources. Differences of methods for determining the numbers of researchers are shown in Table 2-2-1, and would appear to be obstructing a fair statistical comparison.
The category of researcher at universities and colleges, in Japan, consisting of teachers, doctoral students, medical staff, etc., differs between Japan and the United States in the following ways.
(1) Teaching Staff
In 1999, a year in which it is possible to compare teachers in Japan and the United States, 169,070 teachers at universities and colleges in Japan, inclu- ding those in the humanities and social sciences, were classified as researchers. On the other hand, according to Table 8 in the “National Patterns of R&D Resources: 2002 Data Update,” in the United States, only 118,000 college and university teaching personnel who responded that they had obtained a doctoral degree and were primarily engaged in research were classified as researchers ─a smaller result than in Japan.
It would appear, then, that the number of teaching personnel in the United States who are involved in research is much larger than in Japan when the same kind of statistics are used. On the other hand, if the same statistical method used in the United States were applied to Japan, the number of Japanese researchers would be smaller.
Table 2-2-1 Comparison of Japanese and U.S. definitions of researchers
Source:
Japan-Ministry of Internal Affairs and Communications,
Statistics Bureau (Statistics Bureau). "Report on the Survey of Research
and Development" United States-National Science Foundation. "National
Patterns of R&D Resources: 2002 Data Update"
(2) Number of Graduate School Students
A comparison for 1999 reveals that 59,057 people who were studying in doctoral courses, including the humanities and social sciences, in Japan were classified as researchers. This figure is virtually identical to the 1999 figure of 59,007 graduate school students in doctoral courses counted in the Ministry of Education, Culture, Sports, Science and Technology’s “Handbook of Education, Culture, Sports, Science and Technology Statistics (2003 edition).”
In the United States, however, the number of graduate school students receiving remuneration for research assistance work is 91,300 people (NSF, “Science and Engineering Indicators 2004, Appe- ndix Table 5-28”), which is reduced by the FTE (Full-Time Equivalent) rate coefficient of 50% to arrive at a total of about 45,700 researchers. In the United States, therefore, while the count extends beyond doctoral courses to include people in Master’s course programs as well, it is limited to students who are engaged in research assistance work, and is further reduced by a predetermined coefficient. Thus, it is highly probable that the estimate for number of researchers would yield a lower result than Japan’s method of including all students engaged in doctoral course programs. According to Table 8 in the “National Patterns of R&D Resources: 2002 Data Update,” 68,026 graduate school students are regarded as students who are engaged in research assistance work.
Therefore, when making comparisons between Japan and the United States, it is important to remember that the measurement of researcher numbers in Japan is overestimated, primarily at the universities. In 2002, the Ministry of Education, Culture, Sports, Science and Technology conducted a “Survey of Full-time Equivalency Data at Universities and Colleges,” the results of which will be used in the future to estimate the number of researchers.
As a result, while there may be differences in the methods of measuring researcher numbers, it is useful, however, to look at general trends for each country from its own methods. The United States had the largest number of researchers (1999: 1,261,000), followed by Japan, at 791,000 (2005), at 677,000 using FTE (2004), and Germany (2003: 269,000) (Figure 2-2-2).
The total number of researchers in Japan increased by 0.13% in 2003 over the previous year (decrease of 4.34% using FTE), by 3.95% in 2004 over the previous year (increase of 4.45% using FTE), and was followed by a year-on-year increase of 0.47% in 2005 (increase of 0.28% using FTE). However, the 1997 survey included expantion of surveyed industries, and in 2002 included expansion of surveyed industries, a changed survey date, and an altered definition of researchers, etc. The annual average rates of increase since 1985 (using FTE) were 4.60% from 1985-1990, 3.33% from 1990-1995, 2.22% from 1995-2000 and 0.75% from 2000-2005.
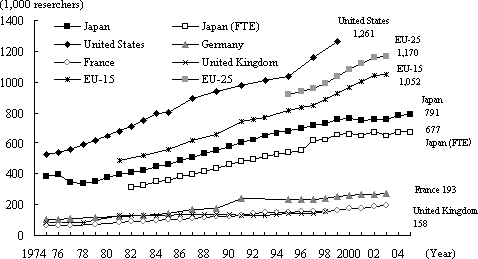
Figure 2-2-2 Trends in the number of researchers in selected countries
Notes 1:
The figures for all countries include social sciences
and humanities.
Notes 2:
Figures for Japan’s number of researchers up to 2001 are as of
April 1, after 2002 are as of Mach 31
Notes 3:
Japan’s FTE values up to 1996 are OECD estimates.
Notes 4:
In Japan, the software industry has been covered in the survey since
FY1997 and the wholesale industry since FY2002.
Notes 5:
U.K. figures through 1983 show total number of researchers in industrial
(scientists and researchers) and national institutions (degree-holding researchers
and above), and do not include universities and private research institutions.
Notes 6:
EU -15 (15 countries: Belgium, Germany, France, Italy, Luxembourg,
Nether-lands, Denmark, Ireland, United Kingdom, Greece, Portugal, Spain, Austria,
Finland, and Sweden) figures are OECD estimates.
Notes 7:
EU -25 (10 countries with EU-15: Cyprus, Czech, Estonia, Hungary,
Latvia, Lithuania, Malta, Poland, Slovak, and Slovania) figures are OECD estimates.
Source:
Japan-Statistics Bureau. "Report on the Survey of Research and
Development"
Others with Japan (FTE values)-OECD, “Main Science and Technol-ogy Indicators”
2.2.1.2 Number of Researchers per 10,000 Population and per 10,000 Laborers
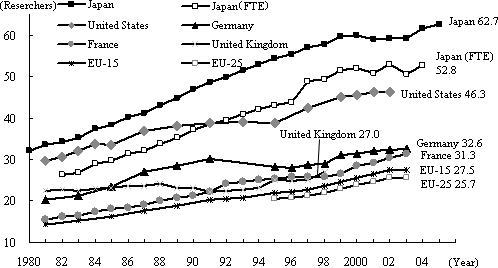
In Japan, the number of researchers per 10,000 people was 62.7 in 2005, while the number of researchers per 10,000 people was 118.2, the highest figures among the advanced nations (Figure 2-2-3).
But the trends in recent years show that the numbers of researchers per 10,000 people and per 10,000 laborers have been flat in Japan since around 2000, but increased again at 2004.
(1) Number of researchers per 10,000 people
(2) Number of researchers per 10,000 labores
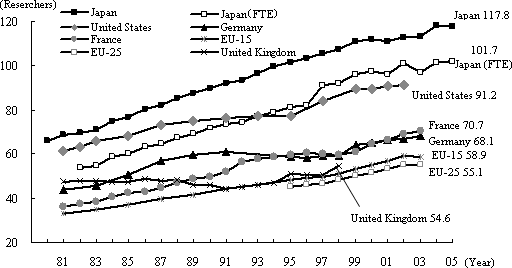
Figure 2-2-3 Trends in the number of researchers per 10,000 people and 10,000 laborers
Notes 1:
The figures for all countries include social sciences
and humanities.
Notes 2:
Figures for Japan’s labor force and number of researchers are as
of March 31 of each year, except up to 2001 are as of April 1.
Notes 3:
EU-15 and EU-25 figures are OECD estimates.
Source:
Number of researchers data: Same as in Figure 2-2-2.;
Population and labor force data: Japan-Statistics Bureau. "Population
Estimates Series", "Monthly Report on the Labor Force Survey"
Other countries include Japan’s FTE value-OECD. "Main Science and Technology
Indicators"
2.2.1.3 Number of Researchers by Sector
As for the number of researchers by type of organization, industry (companies) had the most in Japan at 57.6% of the total, followed by universities and colleges at 36.8% and government research institutions (public institutions) at 4.3%.
The United States has a greater percentage of researchers working in industry, and the percentage of researchers in its government research institutions is low, similar to Japan. In Europe, meanwhile, research personnel are concentrated to a high degree in government research (Figure 2-2-4).
The following sections show the characteristics of researchers in Japan by sector.
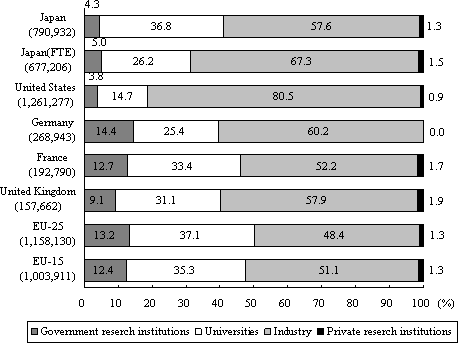
Figure 2-2-4 Share of researchers by sector in selected countries
Notes 1:
For the comparison, statistics for all countries include
research in social sciences and humanities. Statistics for Japan, as of March
31, 2005, include the FTE value for public institutions, universities and colleges,
companies, and nonprofit organizations.
Notes 2:
Japan's FTE values are Statistics Bureau data.
Notes 3:
The data are estimates for the United Kingdom in 1998, the United
States in 1999, and Germany and France in 2003, EU-15 in 2001 and EU-25 are
in 2002.
Notes 4:
Data for private research institutions in Germany is included in
data for government research institutions.
Source:
Japan -Statistics Bureau. "Report on the Survey of Research
and Development";
Others-OECD. "Main Science and Technology Indicators"
(Business Enterprises)
In the last five years from 2000 to 2005 (with 2002 using the revised survey), the number of researchers in business enterprises increased by 5.1% (an average annual rate of increase of 1.00%, from 434,000 researchers to 456,000), which, while slowing, is still increasing compared to other organizations. This hints that industry, as well, has come to place great importance on research and development (Figure 2-2-5)
As for the number of researchers by type of industry, the information and communication electronics and equipment industry registered the highest number, followed in order by the transportation industry, the electrical machinery, equipment and supplies industry, the general machinery industry, the chemical products industry, the electronic parts and devices industry, the software and information processing industry, the drugs and medicines industry (Figure 2-2-6). As for the number of researchers out of 10,000 employees, except for academic research institutions, the information and communication electronica equipment industryhad the largest number, at more than 2.9 times higher than the average for all industries, followed in order by the electronic and electrical measuring instruments industry, the oils and paints industry, the precision machinery industry, and the industrial chemical and chemical fibers industry (Figure 2-2-7). By field of research, engineering ranks the highest. Next is physical science, followed by health, and finally agricultural sciences. Within the engineering field, researchers are concentrated in “electrical engineering and telecommunications engineering,” and “mechanical engineering, shipbuilding and aeronautical engineering.” Within the physical sciences, chemistry has the majority. These three fields employ more than 70% of all Business enterprises rese- archers (Figure 2-2-8).
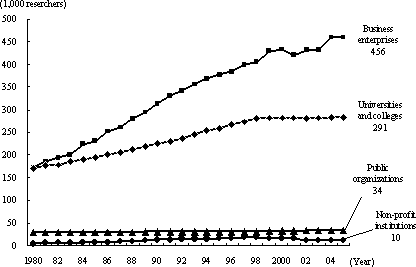
Figure 2-2-5 Trends in the number of researchers by sector in Japan
Notes 1:
Numbers include researchers in the humanities and social
sciences and are as of March 31 of each year, except for FY2001, which is as
of April 1.
Notes 2:
Survey categories were changed in FY2002; numbers up to FY2001 are
for researchers whose primary duty is research at the following organizations
(except at universities and colleges, where the number inclu-des those who
conduct research as an additional post).

Notes 3:
In Japan, the software industry has been covered in the survey since
FY1997 and the wholesale industry since FY2002.
Source:
Statistics Bureau. "Report on the Survey of Research and Development"(See
Appendix 3. (11)
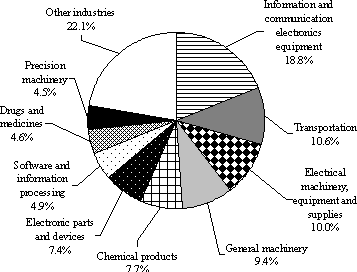
Figure 2-2-6 Researchers at business enterprises, by type of industry (2005)
Source:
Statistics Bureau. "Report on the Survey of Research
and Development"(See Appendix 3. (9))

Figure 2-2-7 Number of researchers per 10,000 employees at business enterprises(top fiveindustrial categories except academic research institutions) (2005)
Notes 1:
Regarding researchers per 10,000 employees, the data
for number of employees and number of researchers are as of March 31, 2005.
Notes 2:
Academic research institutions (5,341 researchers per 10,000 employees)
are not shown on graph.
Source:
Statistics Bureau. "Report on the Survey of Research and Development"(See
Appendix 3. (9))
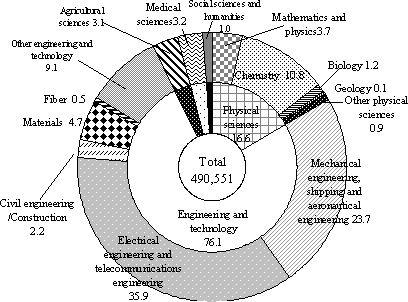
Figure 2-2-8 Composition of number of business enterprises researchers by field of research (2005)
Note:
Figures are their shares in percentages to total company researchers.
Source:
Statistics Bureau. "Report on the Survey of Research
and Development"
(Non-profit Institutions and Public Organizations)
A chronological comparison of the number of researchers is made difficult by the transformation of national experimental research institutions into incorporated administrative agencies, in addition to the revision of the Statistics Bureau’s “Survey of Research and Development.” However, the number of researchers in 2005 stands at 10,000 in non-profit institutions and within public organizations, at 3,400 in national institutions, 13,600 in local government-owned institutions, and 16,900 in public corporations and incorporated administrative agencies (Figure 2-2-9).
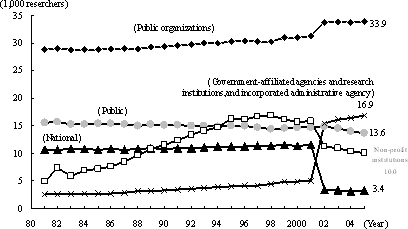
Figure 2-2-9 Trends in the number of researchers in nonprofit Organizations and public institutions
Notes 1:
Numbers include researchers in the humanities and social
sciences and are as of March 31 of each year, ecept up to 2003, which is as
of April 1.
Notes 2:
Survey coverage categories were changed in FY2002; numbers up to
FY2001 for non-profit institutions use the values of private research institutions.
Notes 3:
Values up to FY2001 are for researchers whose primary duty is research.
Source:
Statistics Bureau. "Report on the Survey of Research and Development"(See
Appendix 3. (8))
When looking at sector composition, a disproportionately large share of researchers was seen in engineering at non-profit institutions and among public organizations, in health and engineering at national institutions, in agricultural sciences at local government-owned institutions, and in engineering and the physical sciences at public corporations and incorporated administrative agencies (Figure 2-2-10).
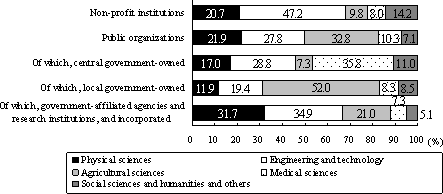
Figure 2-2-10 Composition of researchers in non-profit institutions and Public organizations by organization and field (2005)
Note:
The number of researchers is as of March 31, 2005.
Source:
Statistics Bureau. "Report on the Survey of Research
and Development"
(Universities and Colleges)
The number of researchers at universities and colleges, including those in the humanities and social sciences, has increased by 3.5% in the last five years (2000-2005, an average annual rate of increase of 0.69%) up to 291,000 researchers from 281,000. Looking at the number of researchers by type of institution in 2005, private universities and colleges have 134,900 researchers, followed by national universities and colleges (134,000), after which comes local public universities and colleges (22,300) (Figure 2-2-11). However, in terms of researchers whose primary role is research, the order becomes national universities (127,000), followed by private universities (122,000), and then local public universities (19,000).
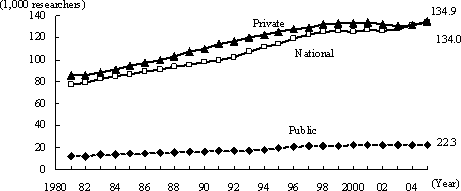
Figure 2-2-11 Trends in the number of researchers in universities and colleges
Note:
Numbers include researchers in the humanities and social sciences and
are as March 31 of each year, except up to 2001, which are as April 1.
Source:
Statistics Bureau. "Report on the Survey of Research
and Development"(See Appendix 3. (8))
Researchers in universities and colleges consist of faculty members, doctoral students, medical staff and others. Looking at the composition of researchers by type of institution, in national universities and colleges, doctoral students make up a large ratio of the researchers, and private universities and colleges have a greater ratio of teachers and medical staffs and a smaller ratio of students for doctoral degrees. The figures for public universities and colleges fall in between those for the national universities and the private universities and colleges (Figure 2-2-12).
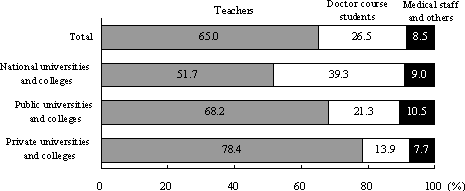
Figure 2-2-12 Composition of researchers in universities and colleges (2005)
Note:
Numbers include researchers in the humanities and social sciences as
of March 31, 2005.
Source:
Statistics Bureau. "Report on the Survey of Research
and Development"
By sector composition, a large share of university researchers were health specialists, whether faculty members, doctoral students, or medical staff. Other sectors with relatively high shares of the total were engineering, for teachers, and science, for students in doctorate programs (Figure 2-2-13).
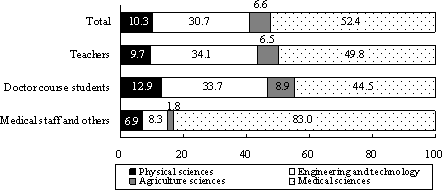
Figure 2-2-13 Share of researchers in the natural sciences at universities and colleges by field (2005)
Note:
The numbers of researchers is as of March 31, 2005.
Source:
Statistics Bureau. "Report on the Survey of Research
and Development"
For the number of researchers by academic field in the most recent five-year period (2000-2005), balanced annual growth rates are seen in the engineering (at 2.21%), agriculture science (at 0.78%), and physical sciences (0.24%), while the health sciences registered a decline of an average annual rate of 0.22% (Figure 2-2-14). Looking at specific sectors, the materials (mining and metallurgy) (average annual growth rate of 9.05%), electrical and telecommunications sectors (average annual growth rate of 2.75%), pharmaceutical sciences (average annual growth rate of 2.72%) and civil engineering and architecture (average annual growth rate of 1.41%) are showing particularly fast increases in the number of researchers (Figure 2-2-15).
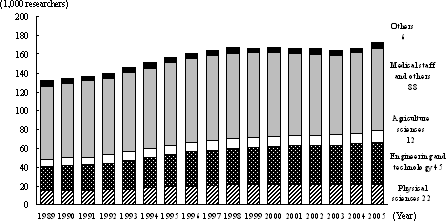
Figure 2-2-14 Trends in the number of researchers at universities and colleges by field and specialty
Note: The number of researchers is for the natural sciences only and is as
of March 31 of each year, except up to 2001, which are as of April 1.
Source:
Statistics Bureau. "Report on the Survey of Research
and Development"
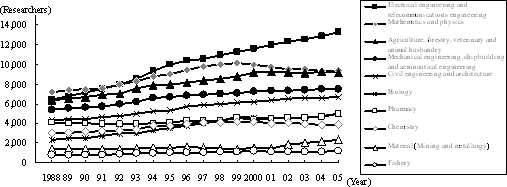
Figure 2-2-15 Trends in the number of researchers at universities and colleges by detaild filed and specialty
Notes 1:
The number of researchers is for the natural sciences
only and is as of March 31 of each year, except up to 2001, which are as of
April 1.
Notes 2:
“Mining and metallurgy” was changed in 2002 to “materials,”
to which was added materials engineering, raw materials engineering, and materials
process engineering, etc.
Notes 3:
The number of researchers excluded those in medical sciences and
dentistry
Source:
Statistics Bureau. "Report on the Survey of Research
and Development"
2.2.1.4 Women Researchers
Women researchers, including those in the humanities and social sciences, have steadily increased year by year, reaching 99,000 in 2005, representing about 11.9% of the total number of researchers (Figure 2-2-16). But looking at all workers, 26.33 million women employees accounted for 41.4% of the total of 63.56 million employees in Japan in 2005, according to the “Labor Survey of the Ministry of Internal Affairs and Communications.” It is clear that the ratio of women engaged in the R&D field remains lower than that of women in the labor market in general. The proportion of women researchers by type of organization was 6.4% at companies, etc., 10.2% at non-profit institutions, 12.2% at public organizations, and 21.1% at universities and colleges, clearly demonstrating that universities and colleges provide women researchers more opportunities than elsewhere.
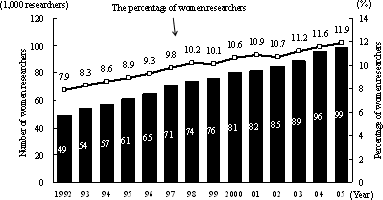
Figure 2-2-16 The percentage of all researchers that are women
Note:
Numbers include researchers in the humanities and social sciences and
are as of March31 of each year, except up to 2001, which are as of April 1.
Source:
Statistics Bureau. "Report on the Survey of Research
and Development"
2.2.2 Personnel Engaged in R&D
The definition of personnel engaged in R&D, which includes both regular researchers and research support staff, varies in scope from one country to the next, so that simple comparisons are probably untenable. Nevertheless, in just such a comparison with the selected countries of Europe, Japan had the largest number of personnel engaged in R&D at 1,010,000, followed in order by Germany, France, and the United Kingdom.
Japan has relatively low numbers of personnel who are engaged in R&D but are not researchers themselves, with 0.28 research support staff for each researcher, a figure that is one-third the standard for European nations (Figure 2-2-17).
The number of research and development-related workers in Japan showed a 1.2% decline in the most recent five-year period (2000-2005). The downward trend in the number of research assistants was in the same five-year period, declining by 15.8%, an annual average of -3.4% (Figure 2-2-18).
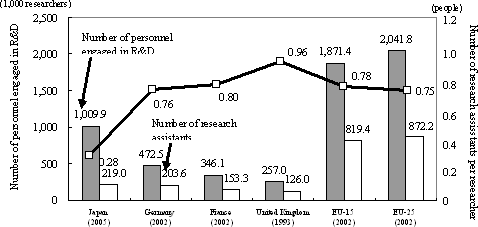
Figure 2-2-17 Number of research assistants per researcher in selected countries
Notes 1:
For comparison, figures for all countries include social
sciences and humanities.
Notes 2:
Figures for EU-15 and EU-25 are OECD estimates.
Notes 3:
Research assistants refers to people who assist researchers, people
who provide technical services that add value to research, and people employed
in research administration, which in Japan is referred to as assistant research
workers, technicians, and clerical and other supporting personnel.
Source:
Japan-Statistics Bureau. "Report on the Survey of
Research and Development";
Others-OECD. "Main Science and Technology Indicators"
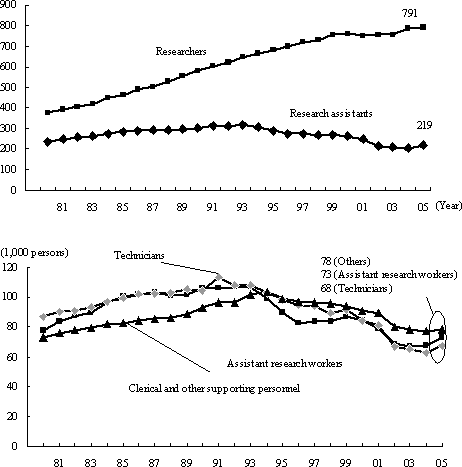
Figure 2-2-18 Trends in persons engaged in R&D in Japan
Note:
Numbers include personnel in the humanities and social sciences and
are as of March 31 of each year, except up to 2001, which are as of April 1.
Source:
Statistics Bureau. "Report on the Survey of Research
and Development"(See Appendix 3. (7))
Regarding R&D-related personnel in 2005, the number of researchers increased to 791,000, assistant research workers to 73,000, technicians to 68,000 and clerical and other support staff to 78,000 (Figure 2-2-18). The number of research assistants per researcher continued to decrease. (Figure 2-2-19).
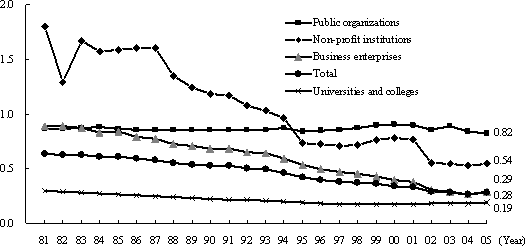
Figure 2-2-19 Trend in the number of research assistants per researcher in Japan
Notes 1:
The numbers of researcher and research assistants include
those in the humanities and social sciences and are as of March 31 of each year,
except up to 2001, which are as of April 1.
Notes 2:
Survey categories were changed in 2002; numbers up to 2001 are for
researchers at the following organizations:

Source:
Statistics Bureau. "Report on the Survey of Research and Development"(See
Appendix 3. (7))
The composition by organization of the number of personnel engaged in R&D in Japan reveals that all universities and colleges, including both public and private schools, have the lowest number of research support staff per researcher (Figure 2-2-20).
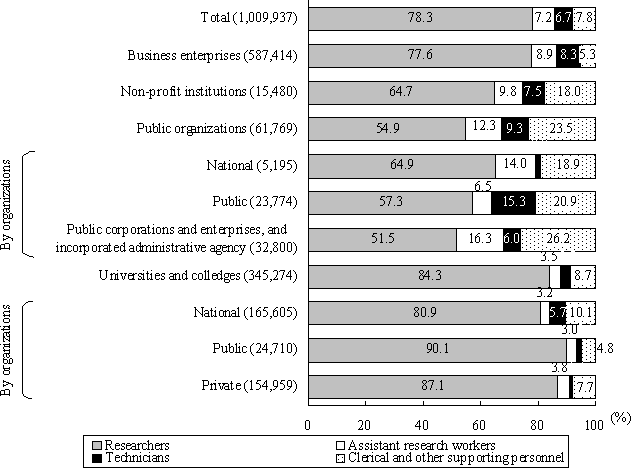
Figure 2-2-20 Composition of personnel engaged in R&D by sector in Japan (2005)
Note:
Numbers for all personnel engaged in R&D include those in the humanities
and social sciences and are as of March31, 2005.
Source:
Statistics Bureau. "Report on the Survey of Research
and Development"
2.2.3 Production and Employment of Research Personnel
2.2.3.1 Overall Degree Trends
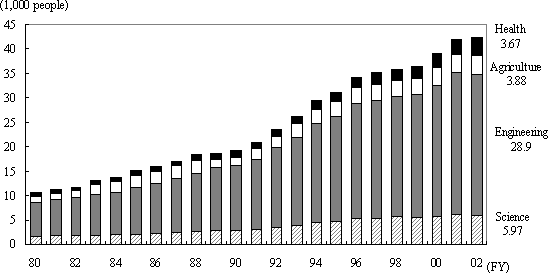
The number of people acquiring a master’s degree or doctoral degree in the natural sciences in Japan has been rising alongside an expansion of graduate schools. While the number of doctorates decreased in 1999, those conferred in 2000 exceeded those conferred in 1998. During the five-year period from 1997 to 2002, the number of master’s degrees conferred rose by 1.11 times (average annual growth rate of 2.1%), and the number of doctorates by 1.11 times (average annual growth rate of 2.2%). Looking at degrees by major for 2002, the engineering field accounted for the largest number of new master’s degree holders at 28,893, while the largest number of new Ph.D.s was in the health science field at 6,853 (Figure 2-2-21).
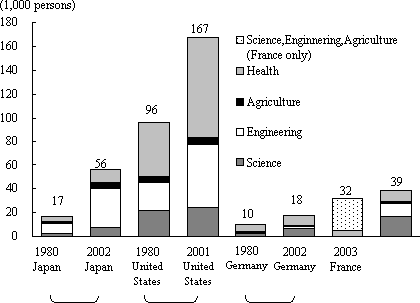
Master’s and doctoral degrees differ from country to country due to differences in culture and educational systems. Social factors such as industrial structure and numbers of students can affect the number of awarded degrees. Thus, it is difficult to compare the data at face value. It is useful, however, to compare trends, and this section describes the degree trends in the natural sciences and engineering in selected countries.
The United States awards the largest number of degrees, a little over three times as many as does Japan. Compared to 1980, the ratio of engineering and health science degrees to total degrees has increased. Japan is second in number of degrees awarded, following the U.S., and has a higher ratio in engineering. The United Kingdom, France and Germany follow in the order named. Of these countries, Germany has a higher ratio in the physical science and health science fields, and the U.K. is higher in physical science and engineering. Also, if we look at doctorates only, the number in physical science fields in Japan is quite a bit lower than in other selected countries (Figure 2-2-22).
The number of graduate school students as a proportion of all university students is also lowest in Japan among selected countries (Figure 2-2-23).
(1) Master's degree
(2) Doctorates
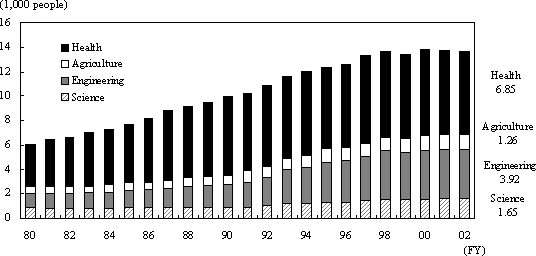
Figure 2-2-21 Degree trends in Japan (natural science)
Note:
The figures are awarded degrees in FY2002.
Source:
MEXT."Statistical Abstract of Education, Science
and Culture 2006."
(1) Total (awarded at graduate schools)
(2) Doctorates
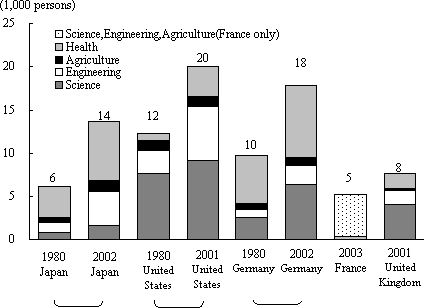
Figure 2-2-22 Number of awarded degrees in selected countries (natural science)
Notes 1:
Totals include master's and doctoral degrees (Germany:
only doctorates). U.S. health sciences include first-professional degrees.
Notes 2:
1980 data for Germany are for the former West Germany.
Notes 3:
France does not distinguish between physical sciences, engineering,
and agricultural sciences.
Source:
MEXT."International Comparison of Education Indexes 2003, 2006"
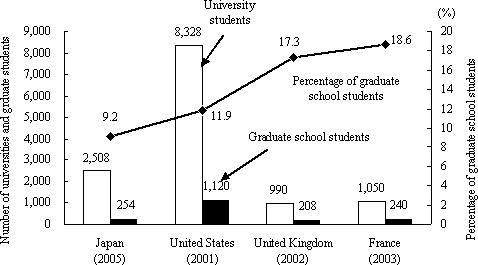
Figure 2-2-23 Number of graduate and university students,and percentage of graduate school students in selected countries
Note:
Numbers for the United States and the United Kingdom are for fulltime
students.
Source:
MEXT."International Comparison of Education Indexes
2006"
2.2.3.2 Employment of Research Personnel
In order to enable the utilization of the skills of research personnel who have received a university and/or graduate school education, it is important that they would be ensured an easy transition into industry or research institutions, etc. after graduation.
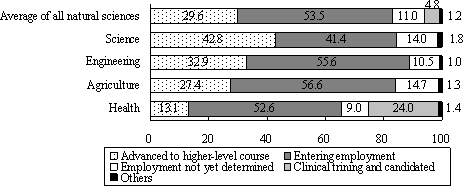
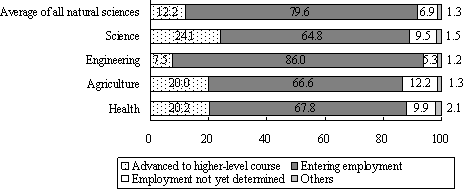
Here, we shall look at the employment situation for Japan’s research personnel from the viewpoint of careers chosen by people in the natural sciences after graduating from university, or after completing master’s or doctoral courses. At the university graduate stage, 42.8% of science specialists continue on to graduate work, a proportion that is higher than other specialties. After completing master’s degrees, the proportion of engineering specialists who continue on with education drops (to 7.5%), with the vast majority (86.0%) turning to employment. After completing doctoral courses, a large proportion (about 30%) of people in physical science and agricultural science fields do not have definite plans for the time after receiving their doctorates (Figure 2-2-24).
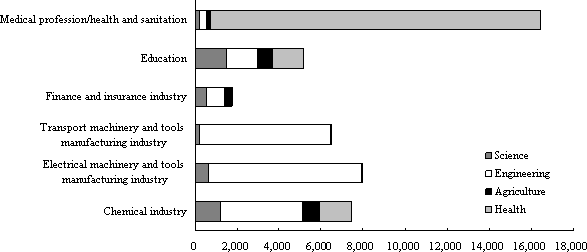
If we look at a number of industries to examine their characteristics in terms of which field of the natural sciences their employees tend to come from, manufacturing industries such as the electrical machinery and tools industry, and the transport machinery and tools industry, consist almost entirely of engineering specialists. By contrast, other manufacturing industries, such as the chemicals industry, take people broadly from all four fields: the physical sciences, engineering, agricultural sciences, and health sciences. In addition, while the electrical machinery, tools manufacturing and other manufacturing industries have a high proportion of personnel who have completed master’s courses, they also have an exceptionally low proportion of people who have completed doctoral courses (Figure 2-2-25).
(1) Upon university graduation
(2) Upon completion of master’s degree
(3) Upon completion of doctor’s degree
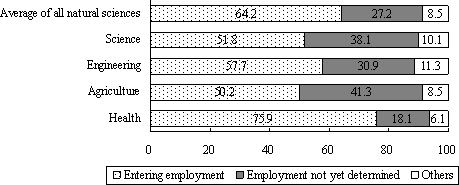
Figure 2-2-24 Trends in career choice, by university degree level (March 2005)
Notes 1:
"Average of all natural sciences" is the average
value of science, engineering, agricultural, and health.
Notes 2:
"Employment not yet determined" refers to people who are
employed in a temporary work, engaged in housework, are not still at school
working as a researcher, have not entered a technical school or other type of
school, a school in a foreign country, or an employment skills development facility,
etc., or are clearly neither engaged in any employment nor enrolled in advanced
education.
Notes 3:
"Others" for those who are university graduation and have
completed a master's degree refers to people who are deceased or unidentified.
Notes 4:
"Other" for those who have completed a doctor's degree
refers to people who have advanced to higher-level course, are engaged in clinical
training to be a physician, or who are deceased or unidentified.
Source:
MEXT."Basic Survey Report on Schools 2005."
(1) By academic field
(2) By academic degree
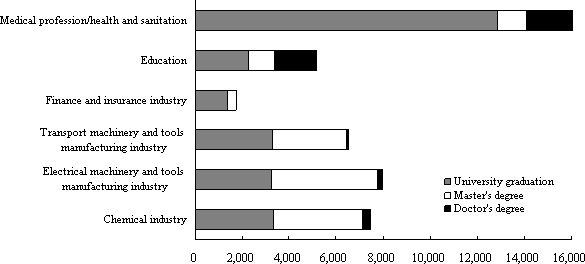
Figure 2-2-25 Employment situation in major industries,by academic field and by degree (March 2005)
Source:
MEXT."Basic Survey Report on Schools 2005"
Contacts
Research and Coordination Division, Science and Technology Policy Bureau
(Research and Coordination Division, Science and Technology Policy Bureau)

