2.3 Trends Related to Research Performance
The data on numbers of scientific papers, numbers of patents applied for and granted, technology trade balances, and high-tech product trade balances, which indicate the results of R&D activities in science and technology, reflect a nation’s activity and level and strength of R&D activities. These statistics are considered to be significant indicators demonstrating levels of R&D and technological strength. This chapter describes these trends in Japan and selected countries.
2.3.1 Scientific Papers
Scientific papers are the results of R&D. It is impossible to make a simple comparison between scientific papers because of the language normally used by the researchers and the language they are written in, etc. However, here is a comparison of the number of scientific papers and the number of citations on the basis of the database(Notes 18) compiled by the Thomson Scientific.
Notes 18:
Thomson Scientific’s database: About 8,730 journals
are listed in the Web of Science database (original data of the National Science
Indicators), of which about 5,900 are natural science journals, about 1,700
are social science journals, and about 1,130 are arts and humanities journals.
The selection standards for the listing of journals are determined according
to the following criteria: (1) International editorial conventions, (2)
Timeliness of publication, (3) Article title, abstract, and keywords, at the
very least, noted in English and (4) Quality sufficiently maintained through
the use of peer review or complete implementation of citations.
2.3.1.1 Trends in the Number of Scientific Papers, and Number of Citations, in Selected Countries
Of the scientific papers published in major scientific journals around the world between 1981 and 2004, Japan’s share of scientific papers and citations was as shown in Figure 2-3-1. Japan’s share of scientific papers in 1981 was fourth in the world, after the United States, the United Kingdom, and Germany.
However, ever since Japan surpassed the United Kingdom in 1992 to obtain the No.2 ranking, Japan has maintained its position at No.2.
Moreover, since excellent papers tend to attract large numbers of citations in other papers, the number of citations can be viewed as one indicator of a paper’s quality. A look at the number of citations of papers authored by Japanese researchers through the year 2000 by year of publication reveals that Japan’s share of total citations has tended to rise over time. Nevertheless, Japan has ranked after the United States, the United Kingdom, and Germany in the number of citations ever since 1989, and the ratio to total citations remains much lower than the share of the total number of scientific papers published (Figure 2-3-1).
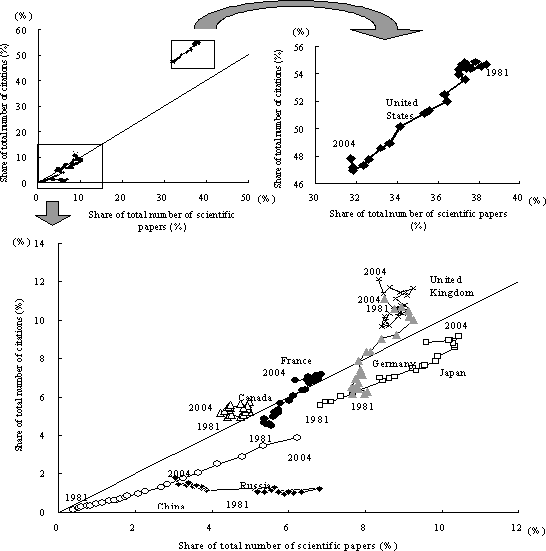
Figure 2-3-1 Relationship between the world total for scientific papers and for citations in scientific papers
Notes 1:
The figures for Russia include those for the Soviet Union.
Notes 2:
The figures for Germany include those for the former East
Germany.
Source:
Collected by the Ministry of Education, Culture, Sports,
Science and Technology based on “National Science Indicators, 1981-2004” (Thomson
Scientific)
2.3.1.2 Relative Citation Impact for Scientific Papers in Selected Countries
The Relative Citation Impact (RCI) shows the number of citations per scientific paper from Japan divided by the number of citations per scientific paper for the world as a whole. Japan’s RCI value is less than 1.0, putting it in a position relatively lower than other major selected countries. Where the RCI for Japan and the United States has stayed relatively stable since 1981, it has risen in the other major countries, with particularly strong increases seen in recent years for the United Kingdom, Germany and France (Figure 2-3-2).
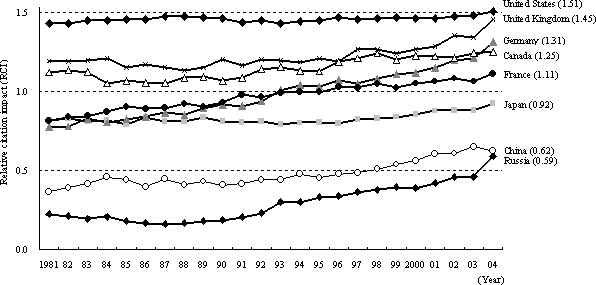
Figure 2-3-2 Trends in the relative citation impact for scientific papers in selected countries
Source:
Collected by the Ministry of Education, Culture, Sports,
Science and Technology based on “National Science Indicators, 1981-2004” (Thomson
Scientific)
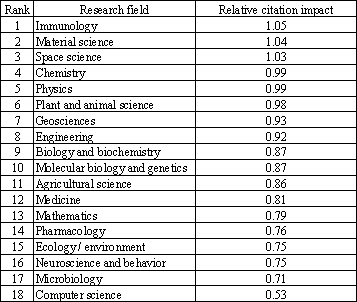
For Japan’s RCI by field, excepting immunology, materials science and space science, no sector exceeds 1.0, and the results are generally low across fields (Table 2-3-3).
Table 2-3-3 Relative citation impact in Japan, by field
Note:
Data is for 2000-2004
Source:
Collected by the Ministry of Education, Culture, Sports,
Science and Technology based on “National Science Indicators, 1981-2004” (Thomson
Scientific)
2.3.1.3 Trends in the Number of Scientific Papers in Selected Countries, by Field
The share of scientific papers written in selected countries by fields from 2000 to 2004 is shown in Figure 2-3-4. The life sciences field, which includes papers in the medical sciences, biology, agricultural sciences, and plant and animal science, accounts for the relatively high proportion of as much as 60% of all scientific papers in the United States and the United Kingdom. In Japan, Germany, and France, by contrast, the life sciences field accounted for about 50% of all scientific papers, with the fields of physics and chemistry accounting for a relatively high 30% of their totals.
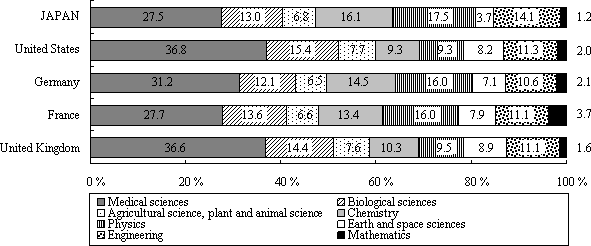
Figure 2-3-4 Number of scientific papers in selected countries, by field
Notes 1:
The composition of each field is as follows. Eighteen
fields listed in the Thomson Scientific's National Science Indicators database
are here amalgamated into eight fields.
(1) Medical sciences: Clinical medicine, immunology, neuroscience and behavior,
and pharmacology
(2) Biological sciences: Biology and biochemistry, microbiology,
and molecular biology and genetics
(3) Agricultural sciences, science:
Agricultural sciences, plant and animal sciences
(4) Chemistry: Chemistry
(5)
Physics: Physics
(6) Earth and space sciences: Space science, ecology/environment,
and geosciences
(7) Engineering: Computer science, engineering, and materials
science
(8) Mathematics: Mathematics
Notes 2:
Figures of shares are calculated based on the numbers
from 2000 to 2004
Source:
Collected by the Ministry of Education, Culture, Sports,
Science and Technology based on “National Science Indicators, 1981-2004” (Thomson
Scientific)
Figure 2-3-5 shows Japan’s scientific papers as a share of all papers written worldwide, by field, for the years 2000 to 2004. Materials science, physics, pharmacology, and chemistry are above Japan’s average for all fields, demonstrating that Japan’s research in these areas is relatively flourishing.
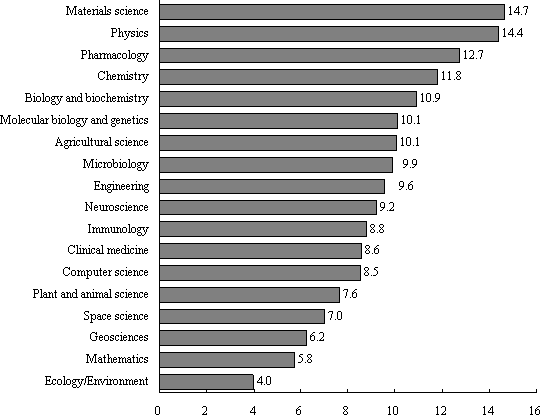
Figure 2-3-5 Japan's share of scientific papers, by field
Notes 1:
Figures are calculated from the aggregate values for 2000-2004.
Notes 2:
Figures are Japan's share of all scientific papers in
the world for each sector.
Source:
Collected by the Ministry of Education, Culture, Sports,
Science and Technology based on “National Science Indicators, 1981-2004” (Thomson
Scientific)
2.3.1.4 Relative Comparative Advantage of Japan’s Scientific Papers by Field
Another indicator marking trends in scientific paper production by field is the “Relative Comparative Advantage (RCA)” indicator. This takes the ratio of a country’s scientific papers in a certain field to the country’s total number of papers, and compares that ratio to the worldwide ratio of field papers to the total number. Figure 2-3-6 shows the trends in RCA for Japan’s scientific papers. We can see that the value for chemistry has generally followed a downward trend through the years, while Earth/space is rising slightly.
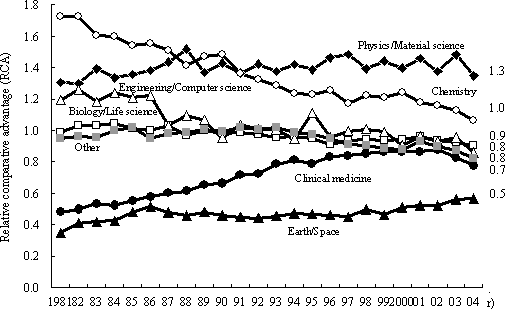
Figure 2-3-6 Trends in relative comparative advantage of scientific papers in Japan, by field
Source:
Collected by the Ministry of Education, Culture, Sports,
Science and Technology based on “National Science Indicators, 1981-2004” (Thomson
Scientific)
2.3.2 Patents
2.3.2.1 Trends in Patent Applications and Patents Granted in Japan
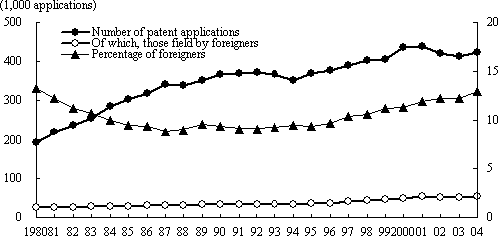
The number of patent applications in Japan peaked in 1992, but then fell when a new system was introduced allowing multiple inventions to be filed under a single patent application. The number of patent applications resumed their increase in 1995. Patent applications in Japan by foreign applicants have been relatively flat in recent years.
Meanwhile, the number of patents granted in Japan has been rising even as the share of patents granted to non-Japanese has decreased (Figure 2-3-12). Note that the sharp increase seen between 1995 and 1996 was mainly due to the patent post-grant objection system, which speeded up the grant process.
(1) Patent applications
(2) Granted patents
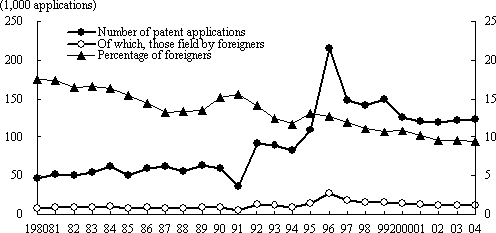
Figure 2-3-7 Trends in number of patent applications and granted patents in Japan
Source:
Japan Patent Office. "Patent Agency Yearbook,"
"Japan Patent Office Annual Report"
2.3.2.2 Foreign Patent Applications and Patents Granted in Japan
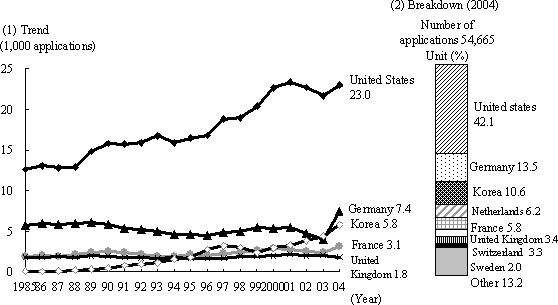
A look by nationality at the number of patent applications by non-Japanese in Japan reveals that while patent applications from the United States returned to increase recently, and Germany and South Korea have been increasing and those from other countries have been generally flat. The number of patents granted peaked in 1996 and has been declining since then (Figure 2-3-8).
(1) Patent applications
(2) Granted patents
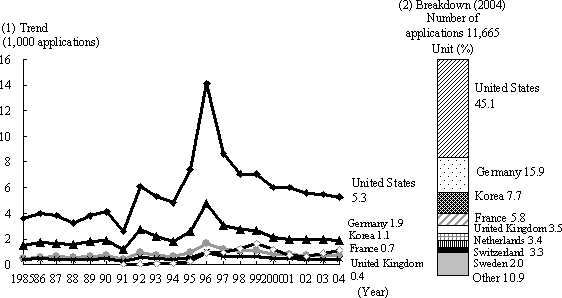
Figure 2-3-8 Number of patent applications and granted patents by nationality of foreign inventors
Source:
Japan Patent Office. "Patent Agency Yearbook,"
"Japan Patent Office Annual Report"IBT
2.3.2.3 Patent Applications in Japan by Field
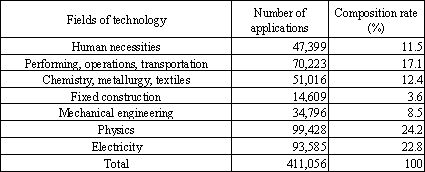
Patent applications by category(Notes 19) in 2003 showed no change in ranking from the previous year (Table 2-3-9).
Notes 19:
Patent classifications are assigned to patents at the
point when the applications are disclosed (after a period of 18 months or more).
Table 2-3-9 Number of patent applications by field of technology in Japan (2003)
Source:
Japan Patent Office. "Japan Patent Office Annual Report
2004"
2.3.3 Technology Trade
Patents, utility models, and technical know-how result from R&D efforts in science and technology. In addition to being used by corporations for their own purposes, they are traded internationally, for example in the form of transfer of rights, approval of utilization, and others. These transactions are what are known as technology trade.
2.3.3.1 Trends in the Technology Trade
The import-export value of technology trade in major selected countries has been growing in response to the advancing globalization of corporate activities, and to trends in recent years that put greater emphasis on intellectual property rights (Figure 2-3-10). While differences in the methods for gathering statistics in each country make simple comparisons difficult, the United States appears to have by far the largest technology trade imports and exports, with the export value, in particularly, soaring far beyond all other countries.
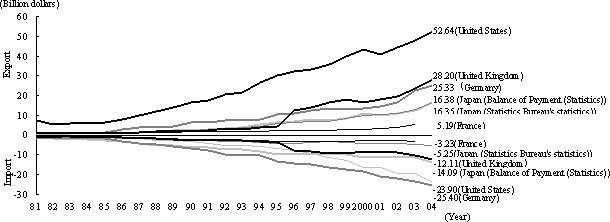
Figure 2-3-10 Trend in technology trade of selected countries
Notes 1:
The amounts are converted into dollars, based on IMF exchange
rate.
Notes 2:
(Balance of Payments Statistics) refers to "Balance
of Payments Monthly" published by the Bank of Japan. (Statistics Bureau's
statistics) refers to the "Report on the Survey of Research and Development,"
published by the Statistics Bureau, Ministry of Public Management, Home Affairs,
Posts and Telecommunications.
Notes 3:
The figures are totals for the calendar year; the fiscal
year is used only for the figures of Japan ("Report on the Survey of Research
and Development").
Notes 4:
The major reasons for differences between the figures
provided by the Bank of Japan and those provided by the Statistics Bureau are
as follows.
1) Survey Method: The Balance of Payments Monthly contains compilations of all sums listed in the balance of international payments item "Royalties and License fees" in reports submitted based on the Foreign Exchange and Foreign Trade Law, while the report on the Survey of Research and Development contains compilations of responses to surveys mailed to companies and handled as designated statistics based on the Statistics Law.
2) Survey Coverage: The Balance of payments Monthly covers all residents who remitted foreign exchange by invisible trade involving 5 million yen or more, while the Survey of Research and Development omits industries such as retail and restaurants from its target.
3) The Scope of Technology Trade: The Balance of Payments Monthly includes rights and technical guidance, etc., for patents, utility models, and know-how, as well as compensation for trademark, industrial designs, and copyrights. Furthermore, the Balance of Payments Monthly does not include technology trade cases where foreign ex-change transfers cover the value of the technology export portions of plant export.
Notes 5:
For Germany, figures up to FY1989 are for the former West
Germany.
Sources:
Japan-Bank of Japan. "Balance of Payments Monthly,"
Statistics Bureau. "Report on the Survey of Research and Development"
Others-OECD
“Main Science and Technology Indicators”
Sources for the value of Japan’s technology trade include the Bank of Japan’s “Balance of Payments Monthly” (hereinafter in this chapter referred to as “Balance of Payments statistics”) and “ Report on the Survey of Research & Development” (hereinafter in this chapter referred to as “Statistics Bureau’s statistics”) by the Statistics Bureau (Ministry of Internal Affairs and Communications). Where the Statistics Bureau’s statistics focus on the state of research activities in Japan, the Balance of Payments statistics focus on foreign currency management.
From the perspective of balance of payments, the Balance of Payments statistics show that the values of imports and exports are nearly equal, while the Statistics Bureau’s statistics show an excess of exports.
2.3.3.2 Trends in the Technology Trade Balance
Japan’s technology trade balance has been rising, while that for the United States has been falling, with the result that the Statistics Bureau’s statistics for 2002 show Japan in the No.1 ranking. While the Balance of Payments statistics had shown an excess of imports, the trade balance has been improving and has rolled over to an excess of exports (Figure 2-3-11). Elsewhere, France and the U.K. have moved into an excess of exports, and Germany is going to shift to an excess of exports.
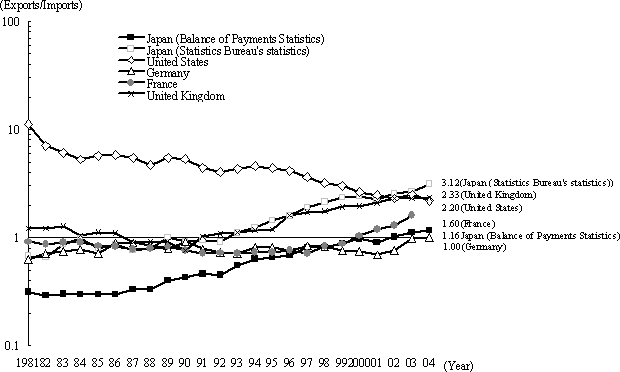
Figure 2-3-11 Trends in the technology trade balance of selected countries
Source:
Same as in Figure 2-3-10
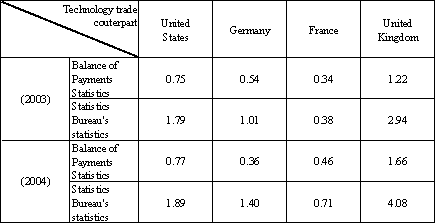
For the technology trade balance between Japan and major selected countries, the Balance of Payments statistics and the Statistics Bureau’s figures show conflicting trends, with the former showing an excess of imports, and the latter showing an excess of exports (Table 2-3-12).
Table 2-3-12 Japan’s technology trade balance with individual selected countries
Note:
The trade balance is a ratio derived by dividing the total
export value by the total import value.
Source:
Bank of Japan. “Balance of Payments Monthly,” Statistics
Bureau. “Report on the Survey of Research and Development”
2.3.3.3 Trends in Japan’s Technology Trade with Other Countries (Regions)
Japan’s technology trade balance with major countries is improving in the long run, with fluctuations in some years, according to the Statistics Bureau’s statistics (Figure 2-3-13).
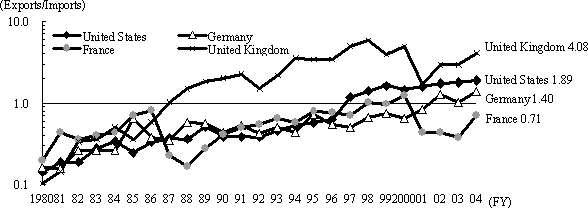
Figure 2-3-13 Trends in technology trade balance of Japan with other selected countries
Note:
For Germany, figures up to FY1989 are for the former West
Germany.
Source:
Statistics Bureau, "Report on the Survey of Research
and Development"(See Appendix 3 (17))
A look at Japan’s technology trade for fiscal 2004 by region shows that North America was the destination for more than half of all technology exports by value, followed in order by Asia and Europe. The United States was the single largest export destination, with more than 40% of all exports by value, while in Asia the major partner countries (regions) were relatively closer to Japan. In Europe, the United Kingdom was the destination with the highest percentage of exports.
For technology imports by value, the United States was the overwhelmingly most important source, at two-thirds of all technology imports, while imports from Europe were distributed relatively evenly from all major European countries except France, which held a disproportionately high share (Figure 2-3-14).
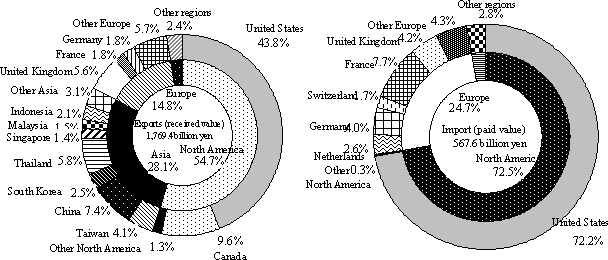
Figure 2-3-14 Composition of Japan's technology trade,by selected country and region (FY2004)
Source:
Statistics Bureau. "Report on the Survey of Research
and Development"
As late as fiscal 1996, Japan had an excess of imports with Europe and North America, and an excess of exports with Asia. Starting in fiscal 1997, however, Japan’s technology trade balance shifted to an export surplus with all regions, and then to an import surplus with Europe in fiscal 2001 (Figure 2-3-15).
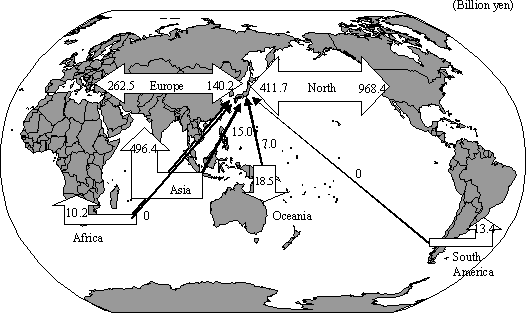
Figure 2-3-15 Technology trade by region (FY2004)
Source:
Statistics Bureau, "Report on the Survey of Research
and Development"
2.3.3.4 Trends of Japan’s Technology Trade by Industry Sector
Using the Statistics Bureau’s statistics to look at Japan’s technology trade by industrial category in the manufacturing sector in fiscal 2004, we find that such high-tech related industries as the motor vehicles industry, the information and telecommunications machinery industry, the electrical parts and devices industry, the electrical machinery industry, and the pharmaceutical industry accounted for the majority of both exports and imports (Figure 2-3-16).
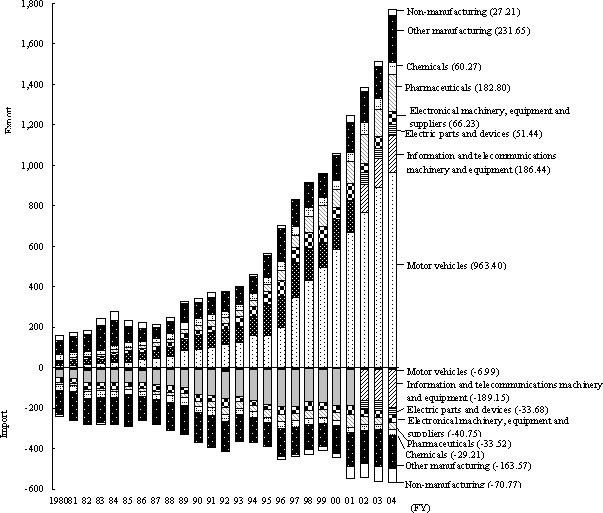
Figure 2-3-16 Trends in technology trade by industry sector
Note:
The software industry in 1996, and the wholesale trade, banking
and insurance, professional services, other services and academic research institutes
in 2001 were newly added to the scope of the survey respectively. The 2002 revision
of industrial categories split "telecommunications, electronics and electrical
instruments" into "Information and telecommunications machinery and
equipment" and "Electrocis parts and devices".
Source:
Statistics Bureau, "Report on the Survey of Research
and Development"
For the trends over time in the technology trade balance, the motor vehicles industry has long had an excess of exports and is steadily widening its technology trade balance. The electrical machinery, equipment and supplies industry, which had once been tilted toward imports, has had an excess of exports since fiscal 1993. While the drug and medicines industry tilted over to an excess of exports in fiscal 1996. The technology trade balance in the electrical parts and devices industry ─a new category since fiscal 2002 ─has shown an excess of exports, while the information and communications machinery industry has shown an excess of imports. (Figure 2-3-17).
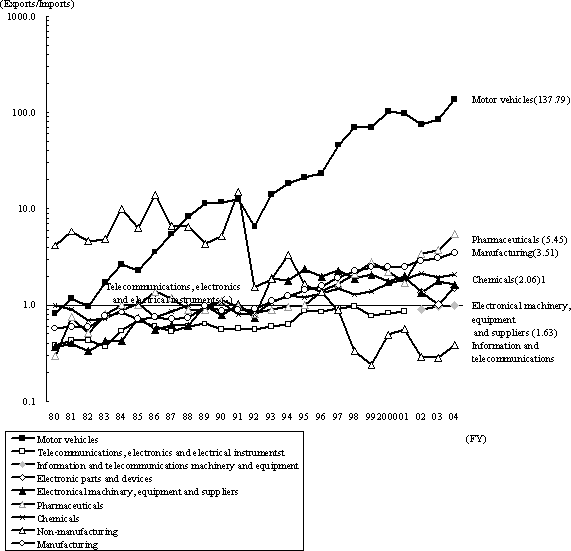
Figure 2-3-17 Trends in technology trade balance in major industry sectors
Note:
The software industry in 1996, and the wholesale trade, banking
and insurance, professional services, other services and academic research institutes
in 2001 were newly added to the scope of the survey respectively. The 2002 revision
of industrial categories split "telecommunications, electronics and electrical
instruments" into "Information and telecommunications machinery and
equipment" and "Electrocis parts and devices".
Source:
Statistics Bureau, "Report on the Survey of Research
and Development"
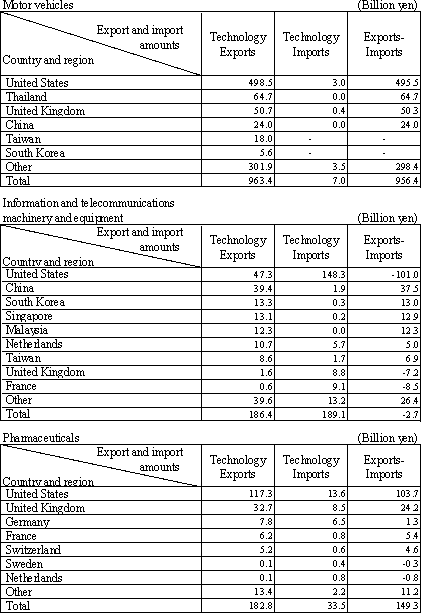
For the balance of payments in technology trade by trade partner country, region and industrial category, the motor vehicle industry shows an excess of exports with all other countries, with a particularly large technology export trade by value with the United States. The information and telecommunications machinery and equipment industry generally shows a strong excess of exports with Asia, but holds an excess of imports overall. The drug and medicine industry trades overwhelmingly with Europe and the United States, and holds an overall export surplus (Figure 2-3-18).
Table 2-3-18 Technology trade balance of payments by trade partner country and region for major industrial categories in Japan (FY2004)
Note:
Symbol Key: "" amounts to exactly zero.
Source:
Statistics Bureau, "Report on the Survey of Research
and Development"
2.3.4 High-tech Industries
High-tech industries(Notes 20) require large investments in R&D, as well as sophisticated technology during their manufacturing process.
For this reason, the size of high-tech product exports can be seen as an indicator of one aspect of an industry’s international competitiveness in science and technology. Therefore, we use OECD data to look at the export shares of high-tech industries, and to make country comparisons of trade balances.
Notes 20:
High-tech industry: At the OECD, the ratio of R&D expenditures
to production is calculated by industry sector, and the five industries with
the highest ratios are classified as high-tech industries: aerospace, office
and computing machinery, electronics, pharmaceuticals, and medical/precision/optical
equipment.
2.3.4.1 Trends in the Export Shares of High-tech Industries in Major Countries
Japan’s share of high-tech industrial exports by value was third to the United States and Germany among OECD countries. This share had been declining. (Figure 2-3-19).
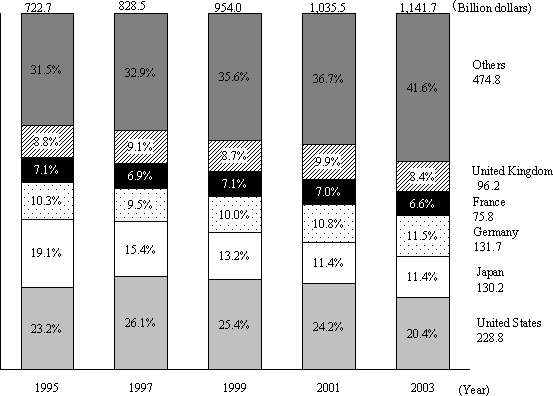
Figure 2-3-19 Export market shares for high-tech products by country in OECD countries
Note:
The amount of export is converted into dollars.
Source:
OECD “Main Science and Technology Indicators”
The total value of high-tech industrial exports has declined in all major countries, while the share for other OECD countries is rising. Japan’s share of the total was particularly high in the electronics industry and medical/precision/optical equipment industry. Japan’s share was relatively low in the aircraft and the drug and products industry (Figure 2-3-20)
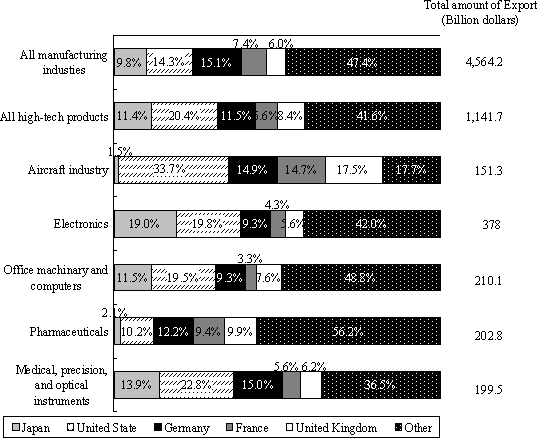
Figure 2-3-20 Share of high-tech products by country manufactured in OECD (2003)
Note:
The amount of export is converted into dollars.
Source:
OECD. “Main Science and Technology Indicators,” "STAN
Database"
2.3.4.2 Trends in Export from and Import to Japan’s High-tech Industry
The trend for Japan’s high-tech industry shows that both exports and imports increased slightly by value. It would appear that the high-tech industry is much less affected by changes in the business climate than the manufacturing industry as a whole (Figure 2-3-21).
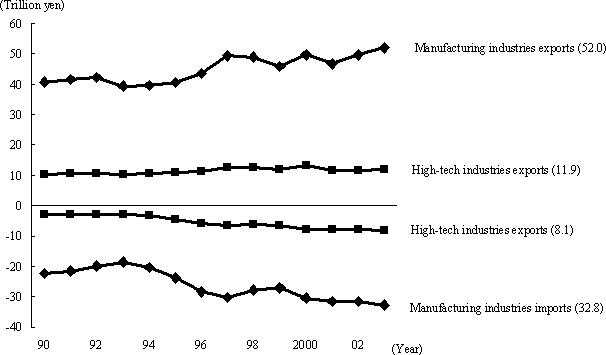
Figure 2-3-21 Trends in imports and exports, by value, for Japan's general manufacturing industry, and the high-tech industry
Source:
OECD. "Main Science and Technology Industries,"
"STAN Database"
2.3.4.3 Trends in High-Tech Industry Trade Balances in Major Countries
A look at Japan’s trade balance in high-tech industries shows that the balance of payments ratio is approaching 1.0. The United States, Germany, France and the United Kingdom have balance of payments ratios nearing 1.0 (Figure 2-3-22).
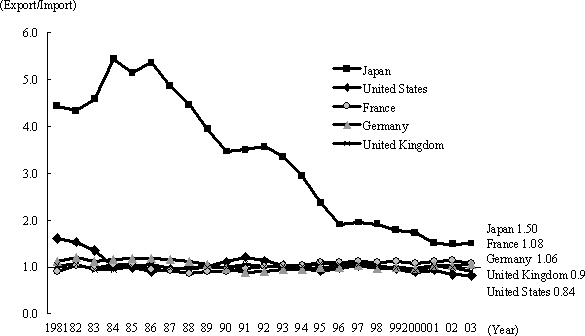
Figure 2-3-22 Trends in high-tech balance of payment ratios for selected countries
Source:
OECD. "Main Science and Technology Indicators"
2.3.4.4 Balance of Payments for Japan’s High-tech Trade, by Industries
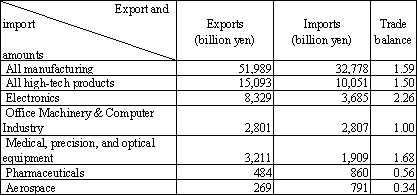
The balance of payments for Japan’s high-tech trade in 2003, by industry, was as shown in Table 2-3-23. The electronics and medical, precision, and optical equipment industries showed a higher balance of payments ratio than the high-tech industry overall. The drug and medicines industry and the aerospace industry, on the other hand, had extremely low balance of payment ratios, and were both heavily tilted toward imports.
Table 2-3-23 Balance of payments for Japan's high-tech trade, by industry (2003)
Source:
OECD. "Main Science and Technology Indicators,"
"STAN Database"
Contacts
Research and Coordination Division, Science and Technology Policy Bureau
(Research and Coordination Division, Science and Technology Policy Bureau)


