| Home > Policy > White Paper, Notice, Announcement > White Paper > EDUCATIONAL STANDARDS IN JAPAN 1971 > CHAPTER |
||
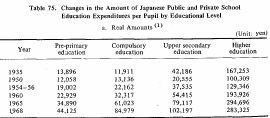
Note: More detailed figures are given in Basic Table 73. Basic Table 73
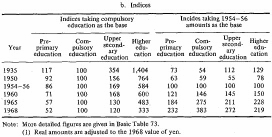
Note: More detailed figures are given in Basic Table 73. Basic Table 73
Table 75 shows the amount per pupil of public and private school education expenditures in Japan by level of education.
Taking compulsory education as the base in each of the years shown, the indices for all the other educational levels show a continuous decline with the decline in higher education being the most conspicuous. Analyzing the indices of each educational level with the average of the years 1954 -56 as the base figure, it is evident that educational expenditures per pupil in compulsory education have nearly quadrupled, and those in upper secondary education, have nearly tripled, while those in higher education have merely doubled.
School education expenditures per pupil in Japan, are further analysed in Table 76 according to the kind of establishing body (national, local public or private).
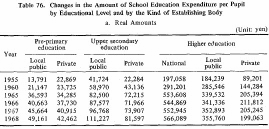
Note: More detailed figures are given in Basic Table 73. Basic Table 73
Taking national or local public school expenditures as the base, the table shows that, throughout all educational levels with the exception of pre-school education in 1960 -65, the amount per pupil in national and local public schools was well over that in private schools. Moreover, such disparities between national and local public schools, on the one hand, and private schools, on the other, have expanded in recent years.
Comparing the indices within each educational level, taking 1955 as the base, it is evident that the increase in the indices for private schools is greater in secondary education than in pre-school and higher education.
Table 77 shows public and private expenditure per pupil by purpose and level, for the year 1968.
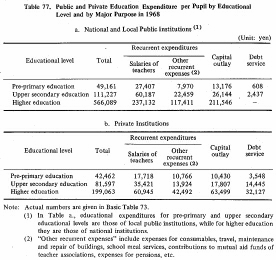
Note: Actual numbers are given in Basic Table 73 Basic Table 73
As shown in the table, the per capita expense for debt service is conspicuously large in private institutions at all educational levels being as high as 32,000 yen (approximately $90) per student in private higher education institutions.
On the other hand, per student expenditures for teachers' salaries, which constitute a large part of recurrent expenditures, are considerably lower in private institutions than in national and local public institutions at all educational levels.
The indices of educational expenditures per pupil for national and local public institutions in various major countries by educational level, using national income per capita as a base of 100 are shown in Table 78.
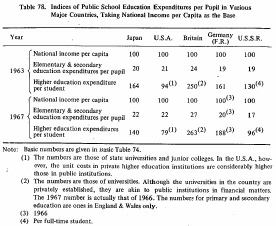
Note: Basic numbers are given in Basic Table 74 Basic Table 74
With per capita national income as a base of 100, the table shows that the indices of primary and secondary school expenditures per pupil remain fairly constant in all the various major countries, however the indices of per student expenditure for higher education, have declined in countries such as Japan, U.S.A. and U.S.S.R., while the indices in Britain and Germany (F.R.) have risen considerably.
The changes in per pupil expenditures in public primary and secondary schools by prefecture show considerable disparity although they are being reduced gradually.
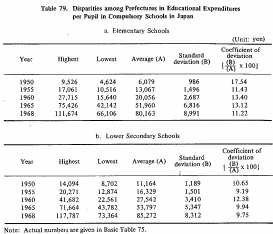
Note: Actual numbers are given in Basic Table 75 Basic Table 75
| Back to Top | MEXT HOME |