| Home > Policy > White Paper, Notice, Announcement > White Paper > EDUCATIONAL STANDARDS IN JAPAN 1971 > CHAPTER |
||
The scale of the national economy of a country is generally expressed in terms of its national income or gross national product (GNP), and it is natural that the amount a country spends for education is decided primarily within the framework of its national income. However, as it is generally accepted that the importance a nation attaches to education can be measured by the portion of its national incomes pent for education, a broad assessment of the degree or intensity of various nation's educational efforts can be made by comparing the percents of their national income devoted to education.
In Japan, public education expenditure, public and private education expenditure and grand total education expenditure from 1955 to 1968, are shown as percents of gross national product and of national income in Figure 39. (The definitions of these terms are given in the notes to Figure 39.)
Figure 39 shows that since 1955 public, public and private, and grand total education expenditure as percents of gross national product and of national income have fluctuated year by year. In 1968, the percents of national income were 4.8%. 6.2% and 7.4%, respectively, and those of gross national product were 3.9%, 4.9%and 5.9%, respectively.
Public education expenditure as a percent of national income is compared31Tl0l1g various major countries in Figure 40.
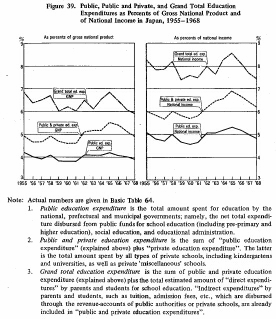
Note: Actual numbers are given in Basic Table 64 Basic Table 64
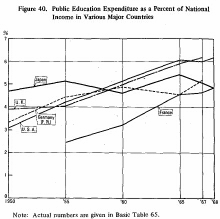
Actual numbers are given in Basic Table 65. Basic Table 65
Until the mid-1950's, the percent was higher in Japan than in any of the other countries shown. Since then however, the percent in Japan has fallen below that inmost other countries. This is because the Japanese figure has remained approximately the same whereas it has continued to grow rapidly in the other countries.
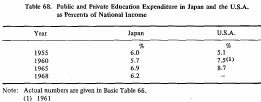
Actual numbers are given in Basic Table 66. Basic Table 66
The educational expenditures shown above are only public education expenditures. Table 68 shows public and private education expenditure as a percent of national income in Japan and the United States of America, the only country for which sufficient data was available.
The table shows that the percent in Japan has lagged behind that of the U.S.A. since around 1960.The correlation between change in the percent of national income devoted to public education and the amount of national income per capita in Japan and various other major countries is shown in Figure 41.
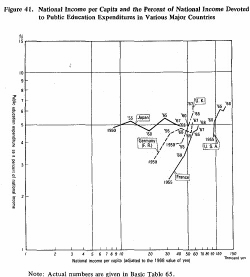
Note: Actual numbers are given in Basic Table 65. Basic Table 65
Despite the relatively low level of her national income per capita, Japan has, until' recently, devoted a higher percent of her national income to education than any of the other major countries. In recent years, however, the rapid expansion of national income in Japan has not been accompanied by a rise in the percent of national income devoted to education and, as a result, the percent in Japan has begun to lag behind those of the other countries.
| Back to Top | MEXT HOME |
)
)
)