| Home > Policy > White Paper, Notice, Announcement > White Paper > JAPAN'S GROWTH AND EDUCATION 1963 > CHAPTER |
||

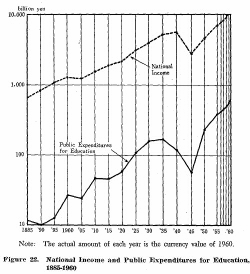
Figure 22 shows the total amount of the national income and of public expenditures for education in Japan by five-year intervals 1885 to 1960.
The total national income increased almost continuously until
1940.As the national economy of this country was seriously affected by World
War ![]() , the
national income in 1945 was less than that in 1925, but increased rapidly after
the war.
, the
national income in 1945 was less than that in 1925, but increased rapidly after
the war.
The curve of public expenditures for education almost paralleled
that of national income, except for a decline in the former in 1905 and in 1915
as a result of increased military expenditures during the Russo-Japanese War
and World War I. Again the marked decrease in the educational expenditures during
the period of 1935-1945 was caused by the pressure or war expenditure for the
Sino-Japanese Incident and World War ![]() .
After the war, the educational expenditures have greatly increased in proportion
to the increase in the national income.
.
After the war, the educational expenditures have greatly increased in proportion
to the increase in the national income.

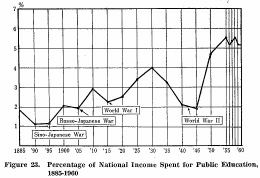
Figure 23 shows the percentage of the national income spent for public education during the same period.
Fluctuations in this curve are more frequent and sharper than in the curves of total national income and public expenditures shown in Figure 22.The percentage of national income spent for education tended to decrease sharply during periods of war and preparation for war, and to increase rapidly in post-war periods. However, during the period from 1950 to 1960 the sharp rise in the national income has actually been accompanied by decrease in the percentage thereof devoted to education.
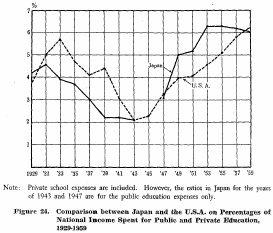
The percentage of national income spent for education in the U.S.A.(including that for private schools) has, as is seen in Figure 24, markedly increased in recent years.

Japan spent considerably lower percentages of its national income for education than the U.S.A. during the period 1933-1941, and considerably higher percentages from 1949 to 1955. The rate of increase in Japan considerably exceeded that in the U.S.A. from 1947 to 1953. However, the rate of increase in the U.S.A. continued almost without change through 1959 whereas in Japan the percentage of national income spent for education has decreased since 1953. This would indicate a lessening effort on the part of Japan and an increasing effort on the part or the U.S.A. to provide support for education.
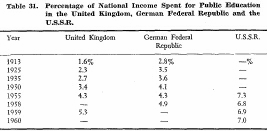
Partial data for three countries, as shown in Table 31, indicate the general trend to devote increasing percentages of national income to the support of public education.

The percentages of total expenditures of national and local governments in Japan that were spent for public education are shown in Figure 25 at five year intervals for the 75 years from 1885 through 1960. The curve shown in this figure is extremely revealing.
Despite minor increases in 1895, 1910, 1915 and 1920, which offset corresponding decreases, the percentage which expenditures for public education were of total governmental expenditures in 1885 was not exceeded unti1 40 years later, in 1925.
After World War ![]() ,
the war expenses reduced to zero and the new educational system started, which
led to the greater ratio of educational expenses. And 21 or 22 per cent of the
total public expenditures is now occupied by the educational expenses. Nevertheless,
it should not be overlooked that the trend in the percentage of national income
spent for education is also true in percentage of total public expenditures spent
for education: the ratio has remained on the same level 111 and after 1956.
,
the war expenses reduced to zero and the new educational system started, which
led to the greater ratio of educational expenses. And 21 or 22 per cent of the
total public expenditures is now occupied by the educational expenses. Nevertheless,
it should not be overlooked that the trend in the percentage of national income
spent for education is also true in percentage of total public expenditures spent
for education: the ratio has remained on the same level 111 and after 1956.

| Back to Top | MEXT HOME |