| Home > Policy > White Paper, Notice, Announcement > White Paper > JAPAMESE GOVERNMENT POLICIES IN EDUCATION,SCIENCE AND CULTURE 1990 > PART |
||
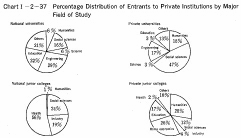
If we classify the existing private universities and junior colleges according to the major field of study of the faculties and departments therein, the following features can be seen:
In private universities, the majority of faculties are in the fields of arts (i.e., humanities, social sciences, fine arts, etc.): more than 60% of all faculties are in these fields. Especially. the proportion of faculties of social sciences and of humanities is much higher for private universities than for national and local public ones. On the other hand, the proportion of faculties in scientific fields (including science, engineering, medicine & dentistry, etc.) is lower for private universities than for national and local public ones.
In private junior colleges, the proportion of departments in
the humanities (27.7%) and in home economics (26.5%) is relatively high. (See
Chart ![]() -2-37.)
-2-37.)

As there is a great difference in the composition of faculties
and departments between national and private institutions, the staffing and physical
conditions of educational and research activities in private institutions cannot
easily be compared with those in national institutions. A general outline of
the staffing ratio and the level of physical facilities in private institutions
is presented below. It can be stated that the level of staffing and physical
conditions in private institutions has been improved in general.
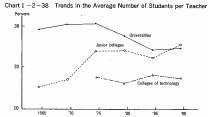
An analysis of the trend in the staffing ratio in private universities
since 1965 indicates that the average number of students per full-time teacher
remained around 30 until the beginning of the 1980's and then it was gradually
reduced until the second half of the 1980's when it became about 24. Whi1e during
the 20 years from1965 to 1985, the total number of students (including graduate
students) in private universities doubled, the total number of full-time teachers
increased 2.4 times. This trend may indicate that private universities have devoted
much effort to improving staffing conditions for their educational and research
activities. (See Chart ![]() -2-38.) The number of students per full-time teacher
for private colleges of technology has remained at between 16 and 18. On the
other hand, the student-teacher ratio for private junior colleges has been increasing
year by year from 15.4 in 1965 and has reached 25 in 1990.
-2-38.) The number of students per full-time teacher
for private colleges of technology has remained at between 16 and 18. On the
other hand, the student-teacher ratio for private junior colleges has been increasing
year by year from 15.4 in 1965 and has reached 25 in 1990.

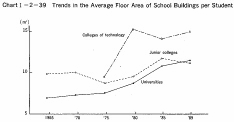
A trend in the development of physical facilities for private
universities, junior colleges and colleges of technology since 1965 shows that
the average floor area of school buildings per student has been gradually increasing
year by year. For example, the average floor area for private universities in
1989 was 1.6 times as large as that in 1965. This fact shows that much effort
has been made by private universities in expanding their physical facilities.
(See Chart ![]() -2-39.)
-2-39.)

| Back to Top | MEXT HOME |