| Home > Policy > White Paper, Notice, Announcement > White Paper > JAPAMESE GOVERNMENT POLICIES IN EDUCATION,SCIENCE AND CULTURE 1990 > PART |
||
The total number of university and junior college students (including graduate students) in Japan reached 2,552,000 in May 1990. It is said that, along with changes in people's daily life caused by social changes in recent years, the daily life of university students has been greatly changing.
With the aim of obtaining basic data useful for improving and enriching student aid programs, every other year since 1968, the Ministry of Education, Science and Culture has been conducting a nation-wide Survey of Student Living, and attempting to ascertain the real living conditions of students with special emphasis on the economic aspects. In 1990, the Ministry commissioned a non-governmental research organ to conduct a Survey on Student Life to ascertain the facts about today's student life and the view of students regarding their own life. For this survey, samples were taken from among sophomore (second-year) and senior (fourth-year) students.
The following subsections will outline the average daily life
of today's university students and their opinions, and the economic aspects of
student life. (Percent-ages shown below represent proportions of total respondents
who gave answers to specific questions, except for those otherwise defined.)
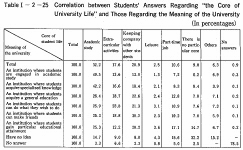
To a question about what concept students have about the university. a relatively large number of students answered as follows (multiple answers):
38.8%![]() "The university is an institution where students acquire
specialized knowledge which can be utilized in society in future."
"The university is an institution where students acquire
specialized knowledge which can be utilized in society in future."
25.8%![]() "The university is an institution where students are
engaged in academic study."
"The university is an institution where students are
engaged in academic study."
24.O%![]() "The university is an institution where students should
acquire a general education useful for citizens."
"The university is an institution where students should
acquire a general education useful for citizens."
On the other hand there were a large number of students who
defined the university as "an institution where students make friends" (40.0%),
and "an institution where students can do what they wish" (35.9%). Students'
concepts about the nature of the university are related to what they think of
the core of their university life, 49.5% of the students who answered that the
university is "an institution where students are engaged in academic study" replied
that the core of their university life rests with "study," and 42.2% of those
who answered that the university is" an institution where students acquire specialized
knowledge" replied in the same way. Many of the students who regarded the university
as "an institution where students make friends" answered that the core of their
own school life Tied in "keeping company with other students" (30.2%). Only 14.1%
of them regarded the core of their school life as "gaining particular educational
attainment." (See Chart ![]() -2-28 and Table
-2-28 and Table ![]() -2-25.)
-2-25.)

Students' rates of attendance at classroom work vary according to the length of enrollment, sex and major field of study. The number of students appending 70% or more of their classroom lessons accounts for 72.7% of all students. (Students attending practically all lessons represent 45.1% of all students.) The proportion of these students is somewhat lower for male students in the fourth year of undergraduate course (60.5%), for male students majoring in the humanities and social science fields (55.1%), and for those students who regard the core of their own university life as "engaging in a part-time job" (56.6%). On the other hand, the number of students who rarely attend classroom lessons accounts only for 5.4%. It may be stated that students' rate of attendance is in general rather high.
The average number of students' working hours outside the classroom (e.g., at libraries and at home) is 8.2 per week for all students. The average number of these hours is 6.3 for male students studying in the humanities and social science fields, (and 8.3 for female students in the same fields, 9.2 for male students in science fields, and 9.3 for female students in the same fields). The average number of volumes of books read by students during one month is 2.6. (Books include those for scientific, technical and professional knowledge and for general culture, and exclude comics. Magazines, textbooks and supplementary textbooks.)
This fact seems to mean that, while students' rate of attendance
at classroom lessons is relatively high, students today don't devote much time
to their independent study. In general, students in their second year of undergraduate
course work harder than students in their fourth year, and students in science
fields work harder than those in the humanities and social sciences. Female students
work harder than male. (See Table ![]() -2-26.)
-2-26.)
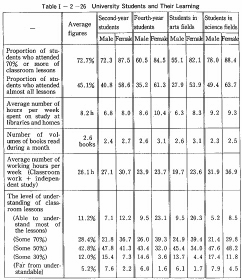
In spite of the fact that students' rate of attendance is relatively high. Many students confess that they can understand "nearly half" of classroom lessons (42.8%of students) and "about 70%" of classroom lessons (28.4%). Only 11.2% of all students answered that nearly all of their classroom lessons were understandable to them. The level of students' understanding of what they are taught is more related to their major field of study than to their rate of attendance at classroom work. The level of students' understanding is higher for arts students than for science students. (In science fields, 26.6% of men and 38.3% of women answered that they could understand 70% or more of classroom lessons, while in arts fields, 34.4% of men and 59.7% of women gave the same answer.) Students in their fourth year gave more positive answers regarding their level of understanding of classroom work than students in their second year did. (The proportion of students answering that they can understand practically all lessons is 7.1% of all men in the second year and12.2% of all women in the same year, while it is 9.5% of all men in the fourth year and 23.1% of all women in the same year.)
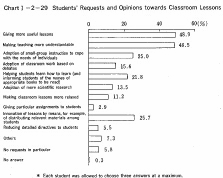
Regarding classroom lessons in general education subjects, many students answered that they were "boring" (48.6% of all students) and that they seemed to be "not useful" (42.5% of all students). Regarding lessons in specialized subjects, many students gave a positive answer: "they seem to be useful" (50.5% of all students), while many other students regarded classroom lessons as "boring" (47.4% of all students).
With the above answers as a background, some fifty percent of
students wished universities to give "more useful lessons" (48.9%) and requested
professors to "make their teaching more understandable" (48.5%). In addition,
many students requested professors to "innovate their teaching methods by, for
example, distributing relevant materials among students" (25.7%) and to "adopt
a small-group teaching to cope with the needs of individual students" (25.0%).
(See Chart ![]() -2-29.) Among students' opinions and requests about classroom lessons,
the request for "more understandable" teaching is more frequently found among
students in science fields. (46.1% of male students in arts fields. 38.8% of
female students in arts fields, 59.4% of male students in science fields and
59.2% of female students in science fields.)
-2-29.) Among students' opinions and requests about classroom lessons,
the request for "more understandable" teaching is more frequently found among
students in science fields. (46.1% of male students in arts fields. 38.8% of
female students in arts fields, 59.4% of male students in science fields and
59.2% of female students in science fields.)
As regards students' participation in extra-curricular activities, 63.3% of students are participants in these activities. This fact indicates that these activities are one of the major elements of student life in universities. The proportion of students participating in each category of extra-curricular activities is as follows 61.1% in "sports activities," 28.2% in "cultural activities," and 6.4% in "social (or community) service and other social participation activities." The average number of hours spent on these activities is 8.3 per week. The participation rate in these activities differs between men and women. While 63.7% of men are in "sports activities," and 24.9% in "cultural activities," 56.1% of women are in "sports activities" and 34.5% in "cultural activities." The proportion of students participating in "sports activities" is higher for men than for women. The average number of hours spent on extra-curricular activities is 9.0 per week for men, while it is 6.7 per week for women. Students participating in no extra-curricular activities at all mention the following reasons: (1) they are "too busy with other activities to participate in extra-curricular activities" (40.2% of all these students) and (2) "there is no activity in which I should like to participate" (29.7%).
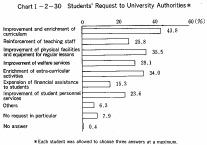
4) Students' requests to universities
Students' requests to universities include: "the improvement and enrichment of curriculum" (43.8% of students), "the improvement of physical facilities and equipment for regular lessons in classrooms, science rooms and other places" (35.5%), "the improvement of physical facilities and equipment for clubs and other extra-curricular activities" (34.0%), "the improvement of physical facilities and equipment for welfare services" (29.1%), "the reinforcement of teaching staff" (25.8%), and "the improvement of student personnel service including guidance on employment" (23.6%). (See Chart I -2-30.) The proportion of students requesting "the improvement and enrichment of curriculum" and "the improvement of physical facilities and equipment for regular lessons" is higher among students whose rate of attendance at lessons is high. While 45.8% of students who have attended almost all lessons demand "the improvement and enrichment of curriculum" and 39.l% of these students call for "the improvement of physical facilities and equipment for regular lessons," 37.8% of students who rarely attend lessons demand the improvement of curriculum and 26.3% of these students call for the improvement of facilities and equipment. The request for "the improvement of physical facilities and equipment for clubs and other extra-curricular activities" was made more frequently by students participating in these activities: 49.4% of these students made this request.
The average high rate of students' attendance at classroom lessons, as well as the high rate of their participation in extra-curricu1ar activities, is reflected upon students' answers to a question as to what constitutes the core of their university life. Many students regard the following elements as the core of their school life: "study" (32.2% of all students), "keeping company with other students" (20.9%), and "extra-curricular activities" (17.6%). Relatively few students (2.5%) regard "leisure" as the core of their university life, and a small number of students (9.0%) answered that "I am just spending time without any core in my life."
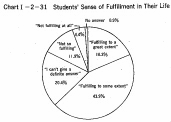
A majority (or 62.2%) of students regard their own life as a "fulfilling" one.
(18.3% of them regarded their own life as "fulfilling to a great extent." and
43.9%as "fulfilling to some extent.") Although 4.4% of students regarded their
own life as "not fulfilling at all," and 11.9% "not so fulfilling." it might
be concluded that on average Japanese university students are living a fulfilling
life with their study and extra-curricular activities. (See Chart ![]() -2-31.)
-2-31.)
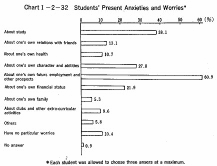
While it may be considered that students today are in general
living a healthy and fulfilling life. a substantial number of students have various
worries on their minds. Only a small number of students (10.4%) answered that "I
have no particular worries." Many students worry about: "future employment and
other prospects" (60.9% of all students), "study" (38.1%), and "my own character
and abilities" (27.8%). (See Chart ![]() -2-32.) These worries seem to be related
to the fact that the students covered in this survey are second-year students
who are going to advance to the specialized upper division of an undergraduate
course and fourth-year students who are planning to get employment. The majority
of fourth-year students (82.7% of women and 72.1% of men) answered that they
had worries about "future employment and other prospects."
-2-32.) These worries seem to be related
to the fact that the students covered in this survey are second-year students
who are going to advance to the specialized upper division of an undergraduate
course and fourth-year students who are planning to get employment. The majority
of fourth-year students (82.7% of women and 72.1% of men) answered that they
had worries about "future employment and other prospects."
Regarding students' choices of future occupations, the majority of the students wish to be an "employee of private enterprises" (62.8%), a "public service personnel" (11.1%) and a "teacher" (10.9%). Those who wish to become "free" part-time workers, who are often taken up by the mass media as an emerging trend, account for only 0.6%. However, the proportion of students answering "I don't mind changing or resigning a job " (27.2%) is almost the same as that of students answering "I had better continue a job until my retirement age" (30.9%). This fact seems to indicate that the mental attitude of students towards lifetime employment has changed into a negative one. Among fourth-year students, however, the proportion of students answering "I had better continue a job until my retirement age"(37.4%) is higher than that of students answering "I don't mind changing or resigning a job" (24.4%).
As regards students' criteria for choosing a particular occupation or work place, many students stressed: "the Job in which l am interested" (63.8%), "the Job in which I can make the best of my abilities and expertise" (40.0%), and "the work-place with a good human atmosphere" (36.0%). Many students placed emphasis on "the job with better salaries" (25.0%) and "the workplace with less working days"(22.3%).
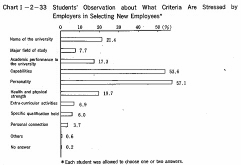
On the other hand, to a question as to students' observation
about what criteria are emphasized by employers in selecting new employees, many
students pointed out the following criteria: "personality, including active attitudes
and cooperative attitudes" (57.1%) and "capabilities, including creativity, planning
ability and judgment" (53.6%). It is noteworthy that only a small number of students
pointed out: "the name of the university from which each applicant graduated" (21.4%)
and "whether each applicant has a personal connection with the staff at the work
place he or she wishes to enter" (3.7%). (See Chart ![]() -2-33.)
-2-33.)
As regards living accommodations, 50.1% of students are living in other than their own homes, and 72.1% of these students are living in "apartments." Of these students, 47.8% are living in a six-tatami room, and 23.2% are in an eight-tatami room (one-tatami is about 1.65m2). And 84.4% of them are living in rooms with an individual bath and toilet. Students living in other than their homes account for 54.1% of men and for 41.7% of women. The number of students living in university dormitories accounts only for 4.1% (3.7% of men and 4.9% of women). Students not living in a university dormitory referred to the reason why they did not choose living in a university dormitory, as: "I wanted to live an independent life" (33.0% of these students). "I was reluctant to live in a group" (23.3%) and "in a university dormitory I have to share a room with some colleagues" (20.7%).
Students were asked to identify the kinds of property they own, as an index of their living standards. They identified: compact disk players (67.5% of students), television sets (65.9%) (93.5% of students living in apartments), telephone (44.1%) (85.6% of students living in apartments) and rice cookers (40.6%) (90.8% of students living in apartments). While these pieces of equipment are prevalent among students. microcomputers, microwave ovens and word processors have not been so widely disseminated. (They are owned by 12.0%, 11.9% and 19.7% of all students, respectively.) Automobiles are owned by 27.4% of students and motorcycles are owned by 30.4% of them.
Students were also asked whether they used such popular contemporary tools as television games, microcomputer communication networks, satellite broadcasting, rental video tapes, "town papers" and entertainment information magazines. To this question, 46.8% of respondents answered they read "town papers" and entertainment information magazines, and 45.9% of them used rental video tapes, while only 5.4% of them utilized microcomputer communication networks and only 6.9% utilized satellite broadcasting. Students enjoying television games at home accounted for 21.2% of all respondents.
Now that, along with the economic development of the nation, the international-ization of various sectors of the Japanese society is in progress, 22.8% of all students have some experience in "traveling abroad," and 27.1% of them "have some friends who are foreign nationals." Women are more positive than men in this respect: 33.7% of female students have experiences in traveling abroad (against17.6% of male students) and 34.4% of them have some friends who are foreigners (against 23.8% of male students).
A majority of students have aspirations for study abroad: 69.4% of ill students wish to go abroad for study purposes. (43.7% of these students want to do so to improve their language ability, and 25.7% to study in respective major fields.) The number of students who answered "I wish to work abroad or travel abroad as employees after getting employment" accounted for as much as 63.1%. Only 3.3% of all students answered "I don't want to go abroad either as a leisure trip or as part of job." These responses indicate that students in general have much interest in going abroad.
Regarding part-time work during student life. 59.2% of all respondents
answered "I am engaged in some par-time work." The average hours spent on such
work is 15.6 per week. The number of hours greatly differs among individuals,
especially between men and women. While 30.3% of men students spend 21 hours
or more on part-time jobs, more than half of women students spend not more than
10 hours, and only 12.6% of them spend 21 hours or more. According to a nation-wide
survey of student living conducted in 1988 by the Ministry, 85.7% of the students
surveyed had some experience in part-time job during the past year. These students
reported the types of their own part-time job, as follows: 55.9% of them were
engaged in "light labor," 25.1% in "tutorial work for school children," and 6.9%
in "clerical work." In addition, 50.7% of the respondents reported that they
had been engaged constantly in part-time job both during academic terms and during
long vacations.
An outline of the economic conditions of day-course students
is presented below on the basis of the results of the Ministry's "Survey of Student
Living" conducted as of November 1988. (The Ministry conducts this survey every
two years.)
The amount of students' fees and other educational and living
expenditures differs among students according to types of institution in which
students are enrolled, types of control of the institution, types of students'
living accommodation, and other factors. The total average yearly amount of student
expenditures is 1,523,000 yen per student, as shown in Table ![]() -2-27
-2-27
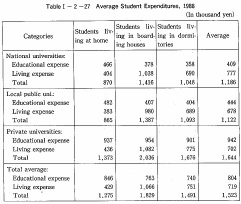
The rate of increase in student expenditures during the two years from 1986 to 1988 is 7.0% (l0.1% for educational expenditures and 3.8% for living expenditures).
a Student expenditures, classified by type of control of institutions
in which students are enrolled
The average total amount of student expenditures per student in 1988 was 1,186,000 yen for national university students. 1,122,000 yen for local public university students and 1,644,000 yen for private university students. The average amount for private university students was approximately 460,000 yen higher than that for national university students.
Students' living expenditures for food, housing, hobbies and
others don't differ so much among national, local public and private institutions.
The difference in the total sum of student expenditures is due to the difference
in the amount of educational expenditures.
The average amount of student expenditures was 1,275,000 yen
for students living at home, while it was 1,829,000 yen for students living boarding
houses and apartments. The difference was about 550.000 yen between the two categories
of student.
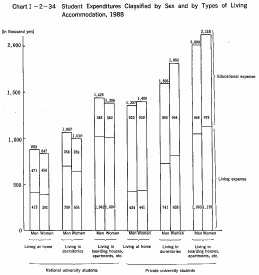
The average total amount of student expenditures for national
university students was higher for men than for women, irrespective of where
students live. (The difference between men and women was 36,000 yen for students
living at home, 39,000 yen for students living in a boarding house or an apartment,
and 57,000 yen for students living in a university dormitory.) The average total
amount of student expenditures for private university students was higher for
women than for men. (The difference between men and women was 43,000 yen for
students living at home, 109,000 yen for students living in a boarding house
or an apartment, and 196,000 yen for students living in a university dormitory.)
(See Chart ![]() -2-34.)
-2-34.)
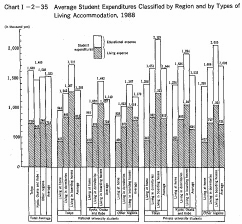
The average total amount of student expenditures for national,
local public and private universities was the highest for students living in
Tokyo Prefecture (1,609,000yen). There was a difference of as much as 1,270,000
yen between student expenditures for private university students living in boarding
houses and apartments in Tokyo (2,129,000 yen) and those for national university
students living at home in regions other than Tokyo, Kyoto, Osaka or Kobe areas
(858,000 yen). (See Chart ![]() -2-35.)
-2-35.)
Student expenditures are met by payments by parents, scholarships,
income from part-time jobs and so forth. The average yearly income per student
is presented in Table ![]() -2-28.
-2-28.
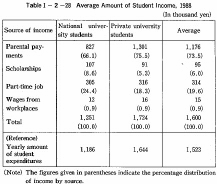
The average year's sum of parental payments to students enrolled
in national, local public and private universities was 1,176,000 yen in 1988.
These parental payments accounted for 73.5% of the total income of students.
While parental payments had been gradually increasing year by year, the proportion
of total student income derived from parental payments had been slightly decreasing
during the past ten years (76.5% in 1978). This decrease was caused by an increase
in student income from part-time jobs and other sources. This increase in student
income took place along with an increase in student expenditures.
Most students are engaged in some part-time jobs so as to make up for their deficient income. The proportion of students who had experiences in participating in a part-time job during one year from December 1987 to November 1988 was 85.7%. The average total amount of income from part-time job was 314,000 yen for students enrolled in national, local public and private universities. This income accounted for 19.6% of total student income. a relatively high percentage next to parental payments.
Historical trends in the proportion of students participating
in a part-time job and in the proportion of student income from a part-time job
during the past decade indicate that both proportions in 1988 was higher than
that in 1978: the proportion of students had increased from 81% in 1978 to 85.7%
in 1988, and the proportion of student income from part-time jobs had increased
from 17.9% in 1978 to 19.6% in 1988. During the decade, there had been a slight
yearly increase or decrease in both percentages.
Regarding the economic conditions of students' parents, the average sum of yearly income of students' families was 7,880,000 yen (7,040,000 yen for national university students, 7,230,000 yen for local public university students, and 8,170,000 yen for private university students). The proportion of total family income devoted to payments to students was 14.9% in average for students enrolled in national, local public and private universities. (The average yearly sum of total parental payments to students was 1,176,000 yen)
The percentage distribution of students by level of family income
indicates that students enrolled in national and local public universities are
distributed rather equally among five levels (Levels ![]() ,
, ![]() ,
, ![]() ,
, ![]() and
and ![]() in
ascending order), although a relatively higher proportion of students fall under
Level
in
ascending order), although a relatively higher proportion of students fall under
Level ![]() (27.4% of national university students and 26.3% of local public university
students) and that a very high proportion of private university students fall
under level
(27.4% of national university students and 26.3% of local public university
students) and that a very high proportion of private university students fall
under level ![]() (30.4%).*
(30.4%).*
*This analysis was made by combining the statistics of students' family income with the statistics obtained from a nation-wide survey of family income and expenditures conducted by the Statistics Bureau, the Management and Coordination Agency. It was assumed that most parents of university students fell between the ages of 45 and 54, and accordingly the distribution of householders in this age range by level of income was compared with the distribution of students' parents according to the level of income.
In 1978 the proportion of students falling under Level ![]() was
22.0% for national university students, 18.4% for local public university students
and 11.1% for private university students. In 1988, ten years later, the proportion
increased to27.4% for national university students. 26.3% for local public university
students and 18.6% for private university students. The fact that a relatively
high proportion of national and local public university students belong to the
lowest income group seems to indicate that national and local public universities
have been contributing to ensuring equal opportunity of education.
was
22.0% for national university students, 18.4% for local public university students
and 11.1% for private university students. In 1988, ten years later, the proportion
increased to27.4% for national university students. 26.3% for local public university
students and 18.6% for private university students. The fact that a relatively
high proportion of national and local public university students belong to the
lowest income group seems to indicate that national and local public universities
have been contributing to ensuring equal opportunity of education.
| Back to Top | MEXT HOME |