| Home > Policy > White Paper, Notice, Announcement > White Paper > EDUCATIONAL STANDARDS IN JAPAN 1975 > CHAPTER6 1 (2) b | ||
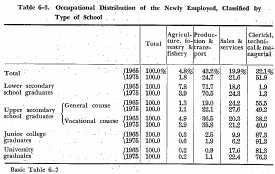
Table 6-3 shows the difference in the types of jobs chosen by new school graduates in March, 1975 and those chosen by new school graduates in March, 1965, in reflection of the change in the industrial structure.
As regards the change in occupational distribution of all new graduates of institutions ranging from lower secondary schools through universities entering employment, the proportion of those employed in agriculture, forestry and fishery and production and transport dropped, while that of those employed in the clerical, technical and managerial sectors rose markedly.

If this distribution is observed at each school level it is found that, among new lower stcondary school graduaes, the proportion of those employed in the agriculture forestry and fishery sector diminished, while in contrast, that of those employed in the sales and service sector rose.
Among new graduates of the upper secondary school general courses, the proportion of those employed in the clerica1, technical and managerial fie1ds declined, while that of those emp1oyed in the production and transport and sales and service sectors gained. On the other hand, as regards new graduates of specialized courses in upper secondary schools, little change has taken place in the distribution of the types of employment taken.
As regards new junior college graduates, the proportion of those employed in the clerical, technical and managerial fields was the largest both in 1965 and 1975, while that of those employed in the sales and service sector declined.
As regards new university graduates, the proportion of those employed in the clerical technical and managerial fields declined, while that of those employed in the sales and service sector turned upward.
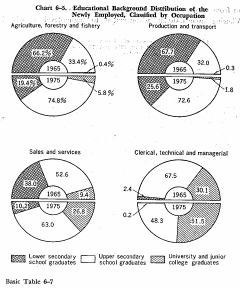
Next, the change in th distribution of the new employees' educational background classified by school level caused by the change in the number of new school graduates, classified by occupation, is shown in Chart 6-5. In reflection of a decrease in new lower secondary school graduates entering employment and an increase in new graduates from schools at the upper secondary level and above entering employment during the last decade, the educational standard in every industrial category has been upgraded.
Above all, in the agriculture, forestry and fishery and production and transport sectors, the proportion of new lower secondary school graduates ranked the highest in 1965 at a little below 70%, but that of new upper secondary school graduates was the highest in 1975 at a little over 70%. And, in the sales and service and clerical, teclmical and managerial sectors, the proportion of new university (undergraduate courses) and junior college graduates showed an outstanding increase.

| Back to Top | MEXT HOME |