| Home > Policy > White Paper, Notice, Announcement > White Paper > EDUCATIONAL STANDARDS IN JAPAN 1975 > CHAPTER1 4 (6) | ||
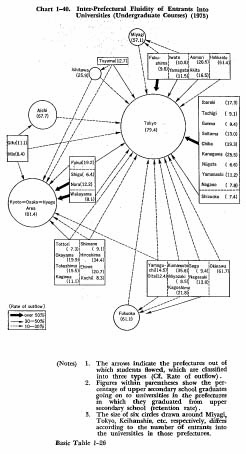
The state of inter-prefectural fluidity of students going on to undergraduate courses is shown in Chart 1-40. In this chart, the state of inter-prefectural inflow and outflow of students going on to universities is shown by arranging the retention rate (the rate of upper secondary school graduates going on to universities in the prefectures where their upper secondary schools were located) in each prefecture and the prefectures into which students flowed, classified by the rate of outflow (the rate of upper secondary school graduates going on to universities in other prefectures) for each percentage group (more than 50%, 30-50% and 10-30%), after calculating the retention rate and rate of outflow among undergraduate course entrants in each prefecture. The national average of retention rate and rate of outflow stood at 36.1% and 63.9% respectively.

According to this chart, more than 10% of undergraduate course entrants in each prefecture flowed out to such prefectures as Tokyo, Osaka, Kyoto, Hyogo, Aichi, Fukuoka, Miyagi and Ishikawa, while the retention rate comes out higher than the rate of outflow in such prefectures as Tokyo, Aichi, Miyagi, Osaka, Okinawa, Kyoto and Hokkaido.
Next, let us observe the difference between the student application rate to universities in prefectures with a large capacity for university students and the prefectures with a small capacity for university students. (The prefectures where the ratio of the number of entrants into universities to the total number of university entrants of the graduates from upper secondary schools in the same prefecture stands above 1 are to be called the "prefectures of inflow", and the prefectures where the same ratio falls below 1 are to be called "prefectures of outflow" hereinafter.)
The proportion of university applicants in upper secondary school graduates of March, 1975 (rate of university applicants) is found higher in the "prefectures of inflow" (56% in "prefectures of inflow" and 46% in "prefectures of outflow"), as shown in Chart 1-41. And the proportion of students applying to the universities of other prefectures is found higher in the "prefectures of outflow."
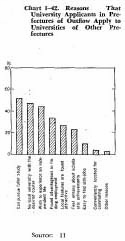
As to the reasons why the university applicants in the "prefectures of outflow" apply to the universities of other prefectures, Chart 1-42 indicates that "can pursue fuller study desired at the universities of other prefectures" comes first followed by "no local university with the desired course."
It may suggest that outflow of students to other prefectures might be reduced, if the universities in the "prefectures of outflow" were much improved and expanded in their educational program and instituted more diverse courses.
Meanwhile, the proportion of successful applicants among these university applicants is shown in Chart 1-43, classified by national and private universities.
It indicates that the proportion of successful applicants among university applicants stands at 48.5% in the "prefectures of inflow" and 61.5% in the "prefectures of outflow," whereas the proportion of university applicants admitted to the universities (and fields of specialization) they had originally wished to enter stands at 15.9% in the "prefectures of inflow" and 23.1% in the "prefectures of outflow." Thus, the higher proportion is shown by the "prefectures of outflow" in both cases.


| Back to Top | MEXT HOME |