| Home > Policy > White Paper, Notice, Announcement > White Paper > EDUCATIONAL STANDARDS IN JAPAN 1975 > CHAPTER1 3 (1) b | ||
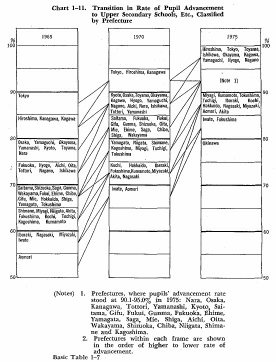
While the rate of lower secondary school graduates across the nation going on to upper secondary education schools has climbed by 21.2% during the last ten years - from 70.7% in 1965 to 9l.9% in 1975 -, as observed in the preceding Section (a), its transition at the prefectural level is shown in Chart 1-11.
The rate of lower secondary school graduates going on to upper secondary education schools may be summarized by the following table:

This table suggests that the prefectural difference had been fairly large till 1970, but quickly narrowed by 1975.
During these ten years, the highest growth of 31.8% was registered by Aomori Prefecture, and more than 20% growth was shown by 33 prefectures, most of which were located in the Tohoku, Kyushu, northern Kanto, Hokuriku and Shikoku Regions, where the rate had been relatively low before. Its growth rate was generally low in prefectures in which big cities were located, and in such prefectures as Kanagawa, Hiroshima, Okayama, Yamaguchi and Yamanashi, where the rate had been high previously.
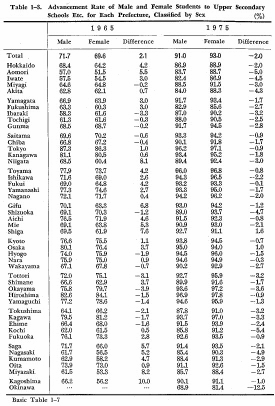
Transition in each prefecture in the rate of lower secondary school graduates going on to upper secondary education schools, as classified by sex, is shown in Table 1-3.


In 1965, the rate of male graduates was higher in 30 prefectures than that of female graduates. Kagoshima Prefecture showed the widest difference between males and females, where the rate of male graduates was 10.0% higher than that of female graduates, followed by Miyazaki, Niigata andShiga Prefectures in that order. In 1975, the rate of male graduates was higher only in the two prefectures of Shiga and Osaka, and the difference between males and females narrowed noticeably even in these prefectures. In the meantime, the rate of female graduates going on to upper secondary education schools was relatively larger in 1965 than that of male graduates in such prefectures as Okayama, Ibaraki, Tottori, etc. In 1975, the rate of female graduates far exceeded that of male graduates in such prefectures as Okinawa, Kochi, Aomori, Nagasaki, Iwate, etc., where the average prefectural rate of lower secondary school graduates going on to upper secondary education schools is considered to have advanced due to the rise in the rate of female graduates.
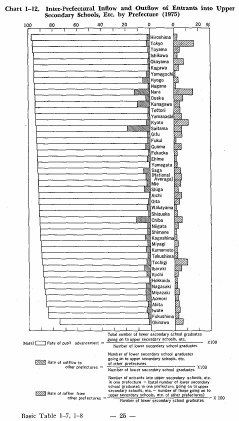
The state of inter-prefectural mobility among lower secondary school graduates going on to upper secondary schools, etc., is shown in Chart 1-12. It shows that a high rate of outflow to other prefectures (the proportion of lower secondary school graduates in certain prefectures who went on to upper secondary schools, etc. in other prefectures), is shown by Saitama, Nara, Chiba, and Kanagawa Prefectures, all of which are located in the peripheral areas of big cities. On the other hand, a high rate of inflow from other prefectures (the proportion of lower secondary school graduates in other prefectures who went on to upper secondary schools, etc. in certain prefectures) is shown by such prefectures as Tokyo, Nara, Kyoto, Tochigi, etc. In this way, the mobility of lower secondary school graduates going on to upper secondary schools, etc. is high in the Tokyo metropolitan district and Kinki district, with a high rate of inflow shown by Tokyo and Kyoto and a high rate of outflow by the three prefectures of Saitama, Chiba and Kanagawa. The rate of both outflow and inflow is high in Nara Prefecture.

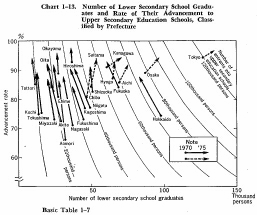
The relationship on a prefectural level between the transition in the number of lower secondary school graduates and the rising trend in the rate of lower secondary school graduates going on to upper secondary schools, etc., is shown in Chart 1-13. It indicates that the rate of lower secondary school graduates going on to upper secondary schools, etc. climbed in every prefecture during 1970 through 1975. In regard to this relationship, prefectures may be classified into three different groups. That is, such prefectures as Tokyo, Osaka, Aichi, Hyogo, Kanagawa, Chiba, etc. fall into the group where both the number of lower secondary school graduates and the number of those graduates who went on to upper secondary schools, etc. have been on the increase, while such prefectures asNiigata, Kagoshima, Fukushima, Akita, Oita, etc. fall into the group where both the number of lower secondary school graduates and the number of those graduates who went on to upper secondary schools have been on decrease. Such prefectures as Hokkaido, Shizuoka, Hiroshima, Nagasaki, Okayama, Aomori, etc. fall into the group where the number of lower secondary school graduates has been on the decline, while the number of those graduates going on to upper secondary schools, etc. has been on the increase or remained at the same level.

| Back to Top | MEXT HOME |